Cardano Price Analysis: First Evidence of Nearby Bottom, Will ADA Soon Retest $1?
It has already been 240 days of a continuous downtrend for ADA, and it’s not over yet. Despite that ADA formed a promising market structure in March, April’s monthly candle so far is showing a 35% drop.
Technical Analysis
Technical Analysis By Grizzly
The Daily Chart
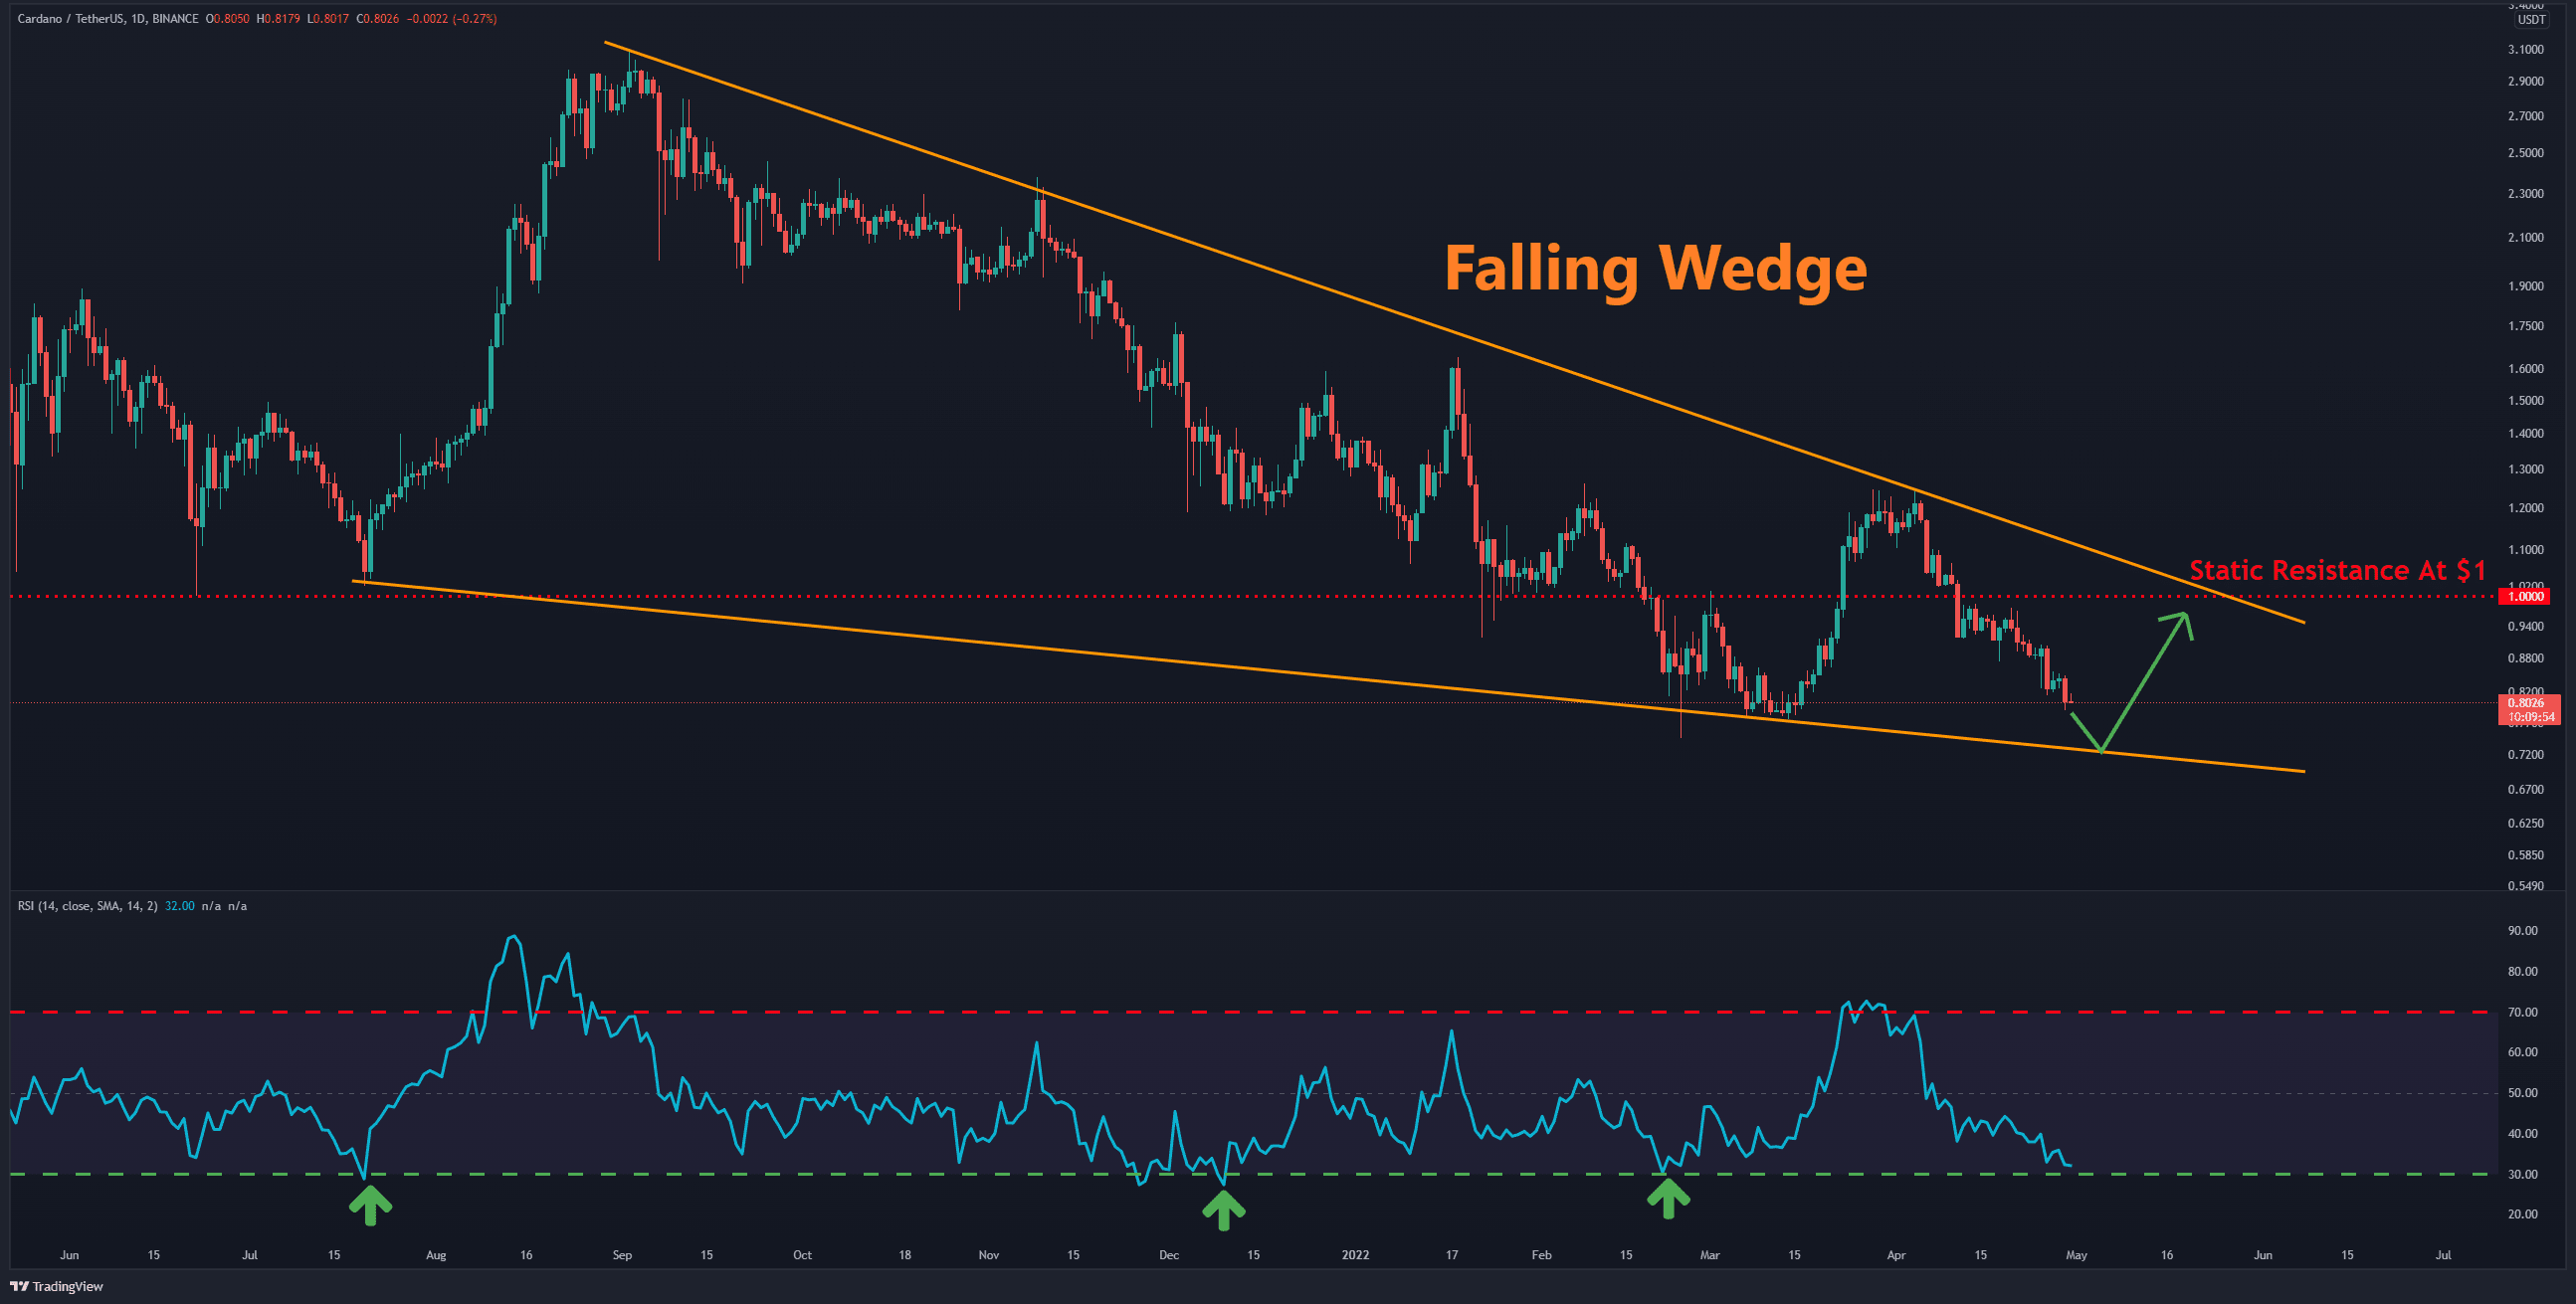
Cardano (ADA) is trading inside a falling wedge (marked orange) on the daily timeframe, which is technically a reversal pattern. Also, the RSI indicator has also reached a level at which the price has started to rise in the previous times after touching that.
By hitting the wedge’s bottom, the RSI indicator will also enter the oversold area, and a possible correction leg towards resistance at $1 could take place.
A bullish scenario is valid if support at $0.7 can prevent a further price drop. Otherwise, the newly formed trend must be re-tested by forming a lower low. Furthermore, breaking the challenging resistance in the $1-$1.25 can be considered the end of the months-long downtrend.
Moving Averages:
MA20: $0.90
MA50: $0.97
MA100: $0.98
MA200: $1.31
The 4-Hour Chart
On the 4-hour timeframe, the price is moving down inside a falling wedge just like seen on the daily chart. Horizontal support at $0.8 is a key level, and if the price finds support – a double bottom can be formed. Since both of these patterns are technically bullish, it remains whether the bulls can hold this level again.

Short-term Support Levels: $0.8 & $0.75
Short-term Resistance Levels: $0.85 & $0.88