Bitcoin Price Analysis: After Rejecting at $40K, BTC Could Drop to $36K and Below
Bitcoin has slowly declined over the past few days. The price got rejected at the 100-day moving average line twice last week, and now the 100-day and 50-day moving average lines turned into heavy resistance levels.
In addition, the $40k level is also acting as a significant static resistance level, and the price has been trading below it for most of the time over the past week.
Technical Analysis
Technical Analysis By: Edris
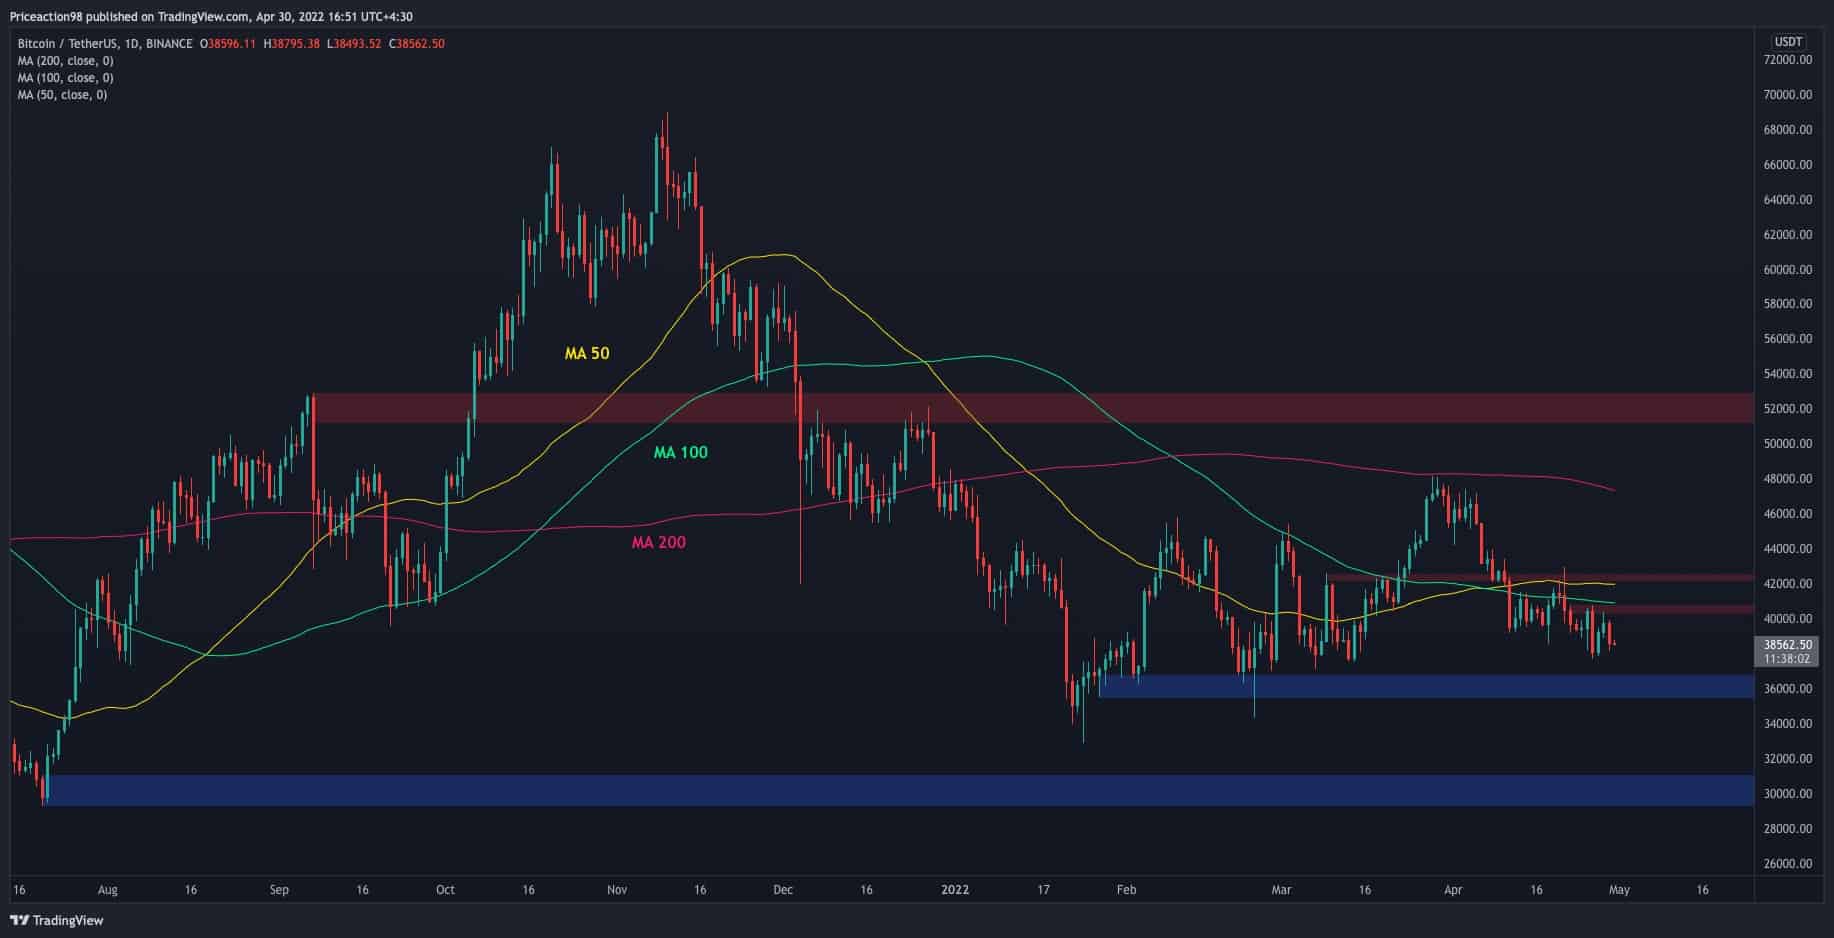
The Daily Chart
The recent trajectory of lower highs and lows has been forming on the chart, indicating a continuation of the bearish trend. As it seems now, BTC’s price targets the $36K support area in the short term, which has held the price on multiple occasions over the past year. However, a break below it could result in a rapid drop towards the $30K demand zone.
The 4-Hour Chart
On the 4-hour timeframe, it is evident that the price is getting closer to the lower boundary of the marked bearish flag after getting rejected from the $40K zone.
However, the price action forms a falling wedge pattern, which is considered a bullish reversal pattern. For a reversal to take place, the price needs to break above the higher trendline of the wedge. In that case, we can expect BTC to retest the $43K level and even higher.
Furthermore, the three touches at the lower trendline of the falling wedge signal a clear bullish divergence with the RSI, which adds to the probability of a bullish rebound in the short term. On the other hand, the bearish scenario in the mid-term is still probable, and if the falling wedge pattern fails, the sell-off would be accelerated, and the price could drop to $36K, as mentioned above.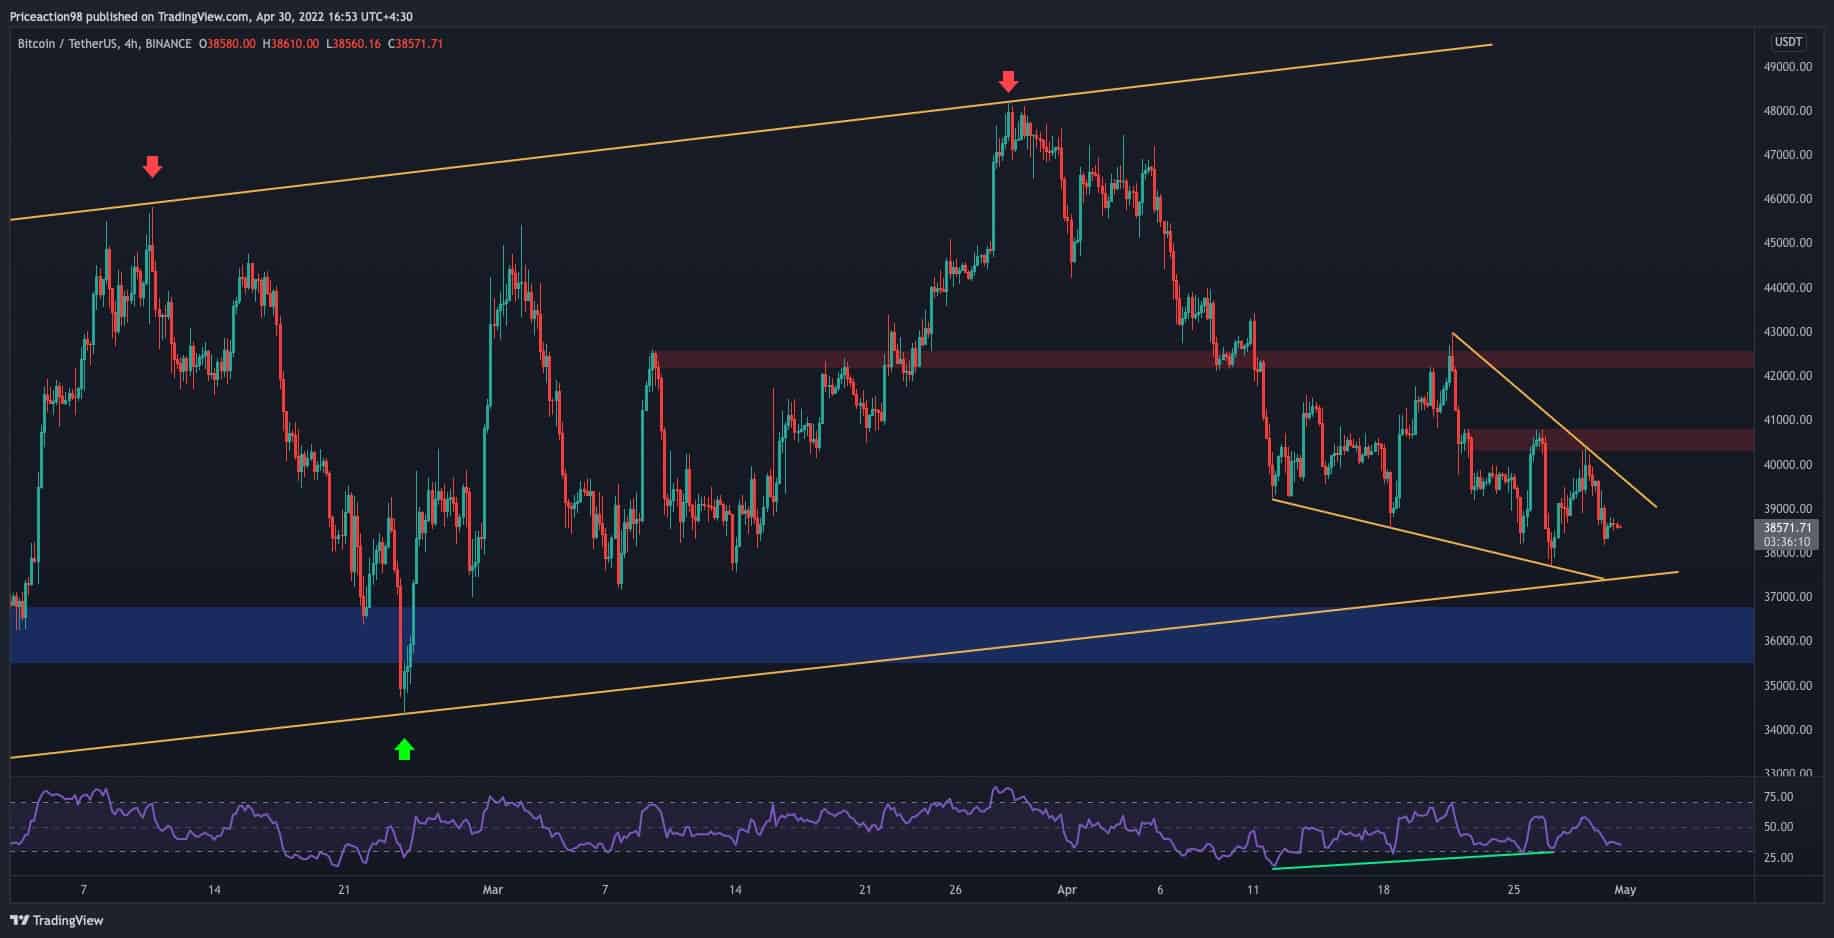
Onchain Analysis
Onchain Analysis By Shayan
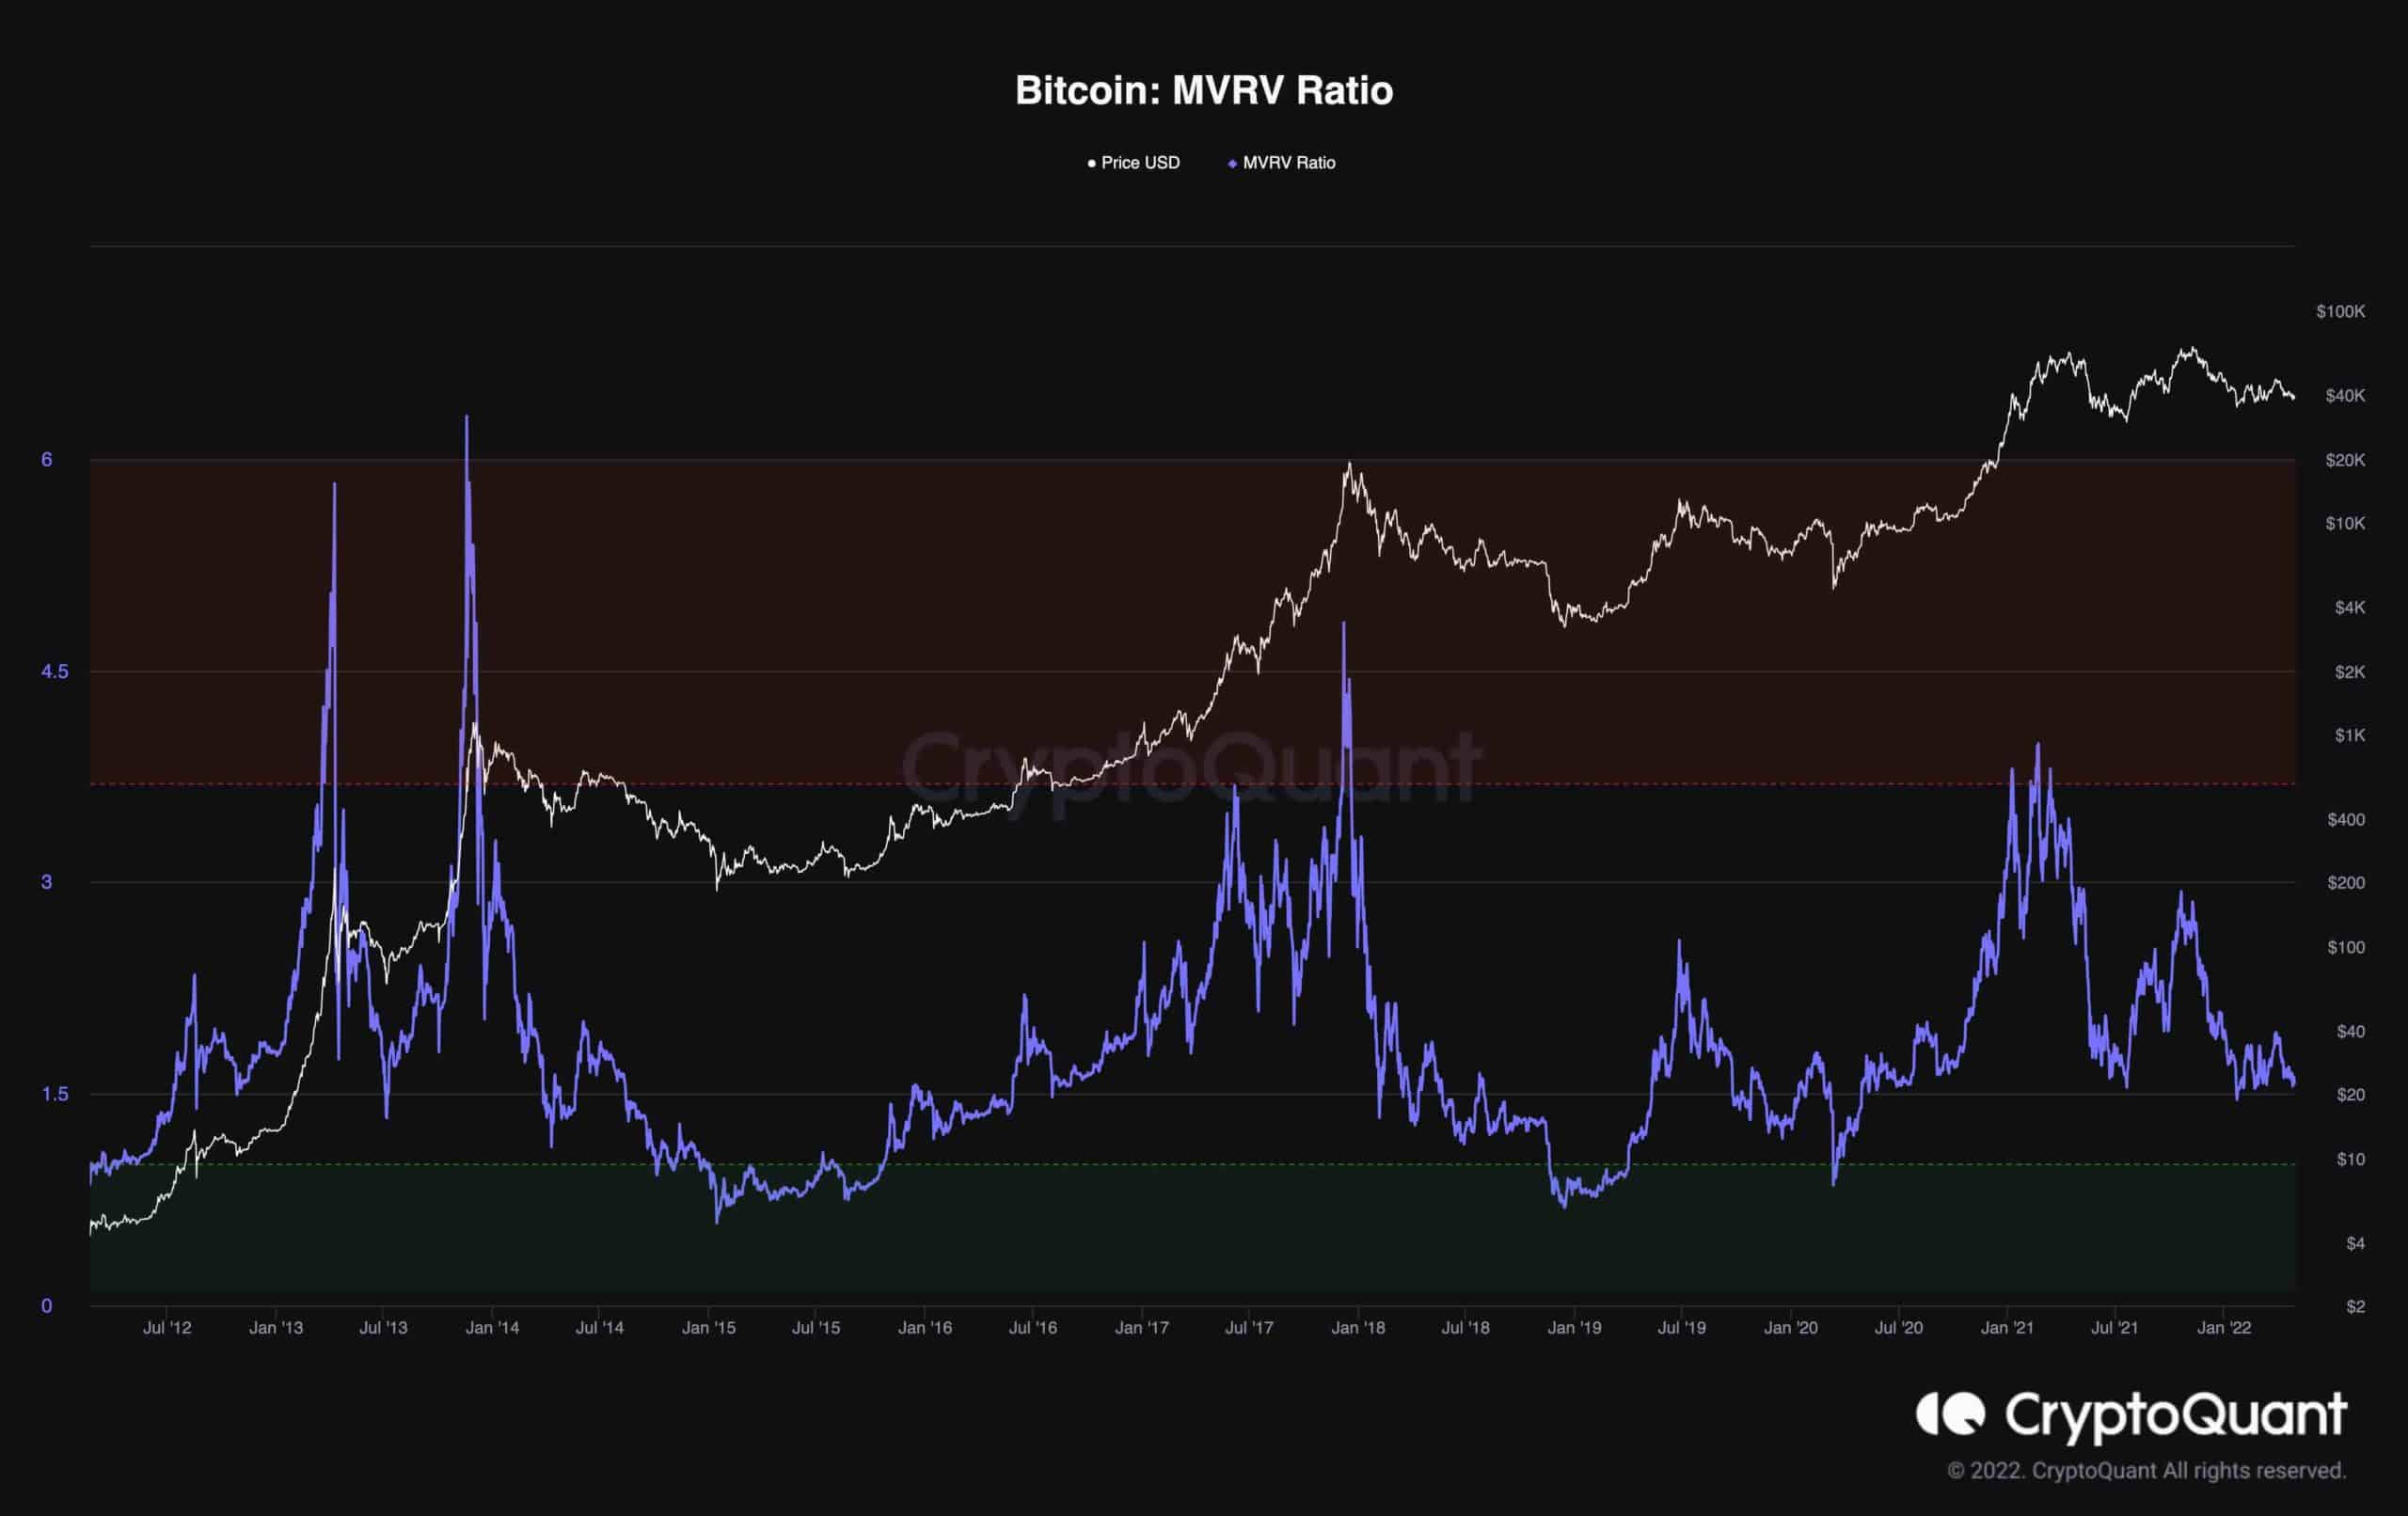
The MVRV is the ratio of a coin’s Market Cap to its Realized Cap, which indicates whether the price is overvalued or not. This may be the most informative on-chain indicator to map the present market situation.
Values over 3.7 have historically suggested market tops, while values below 1 suggested market bottoms. The MVRV is at 1.5739, and the market’s momentum is not encouraging.
As a result, the probability of having an MVRV of 1 or below in the mid-term is significant. Unless a macro catalyst drives demand and price begins to gain traction, even if it is only a short-term rebound, such as in early 2018.