Can BNB Hold Above $230? Here’s What You Need to Know (Binance Coin Price Analysis)
BNB’s momentum is shifting to the bearish side. The bulls are starting to feel the pressure.
Key Support levels: $230
Key Resistance levels: $260
1. Flat Trend About to End
BNB is stuck in a flat channel. This is a consolidation period that will likely end in a violent breakout once the price decides on a direction. With good support at $230 and resistance at $260, it seems market participants have a hard time breaking these key levels right now.
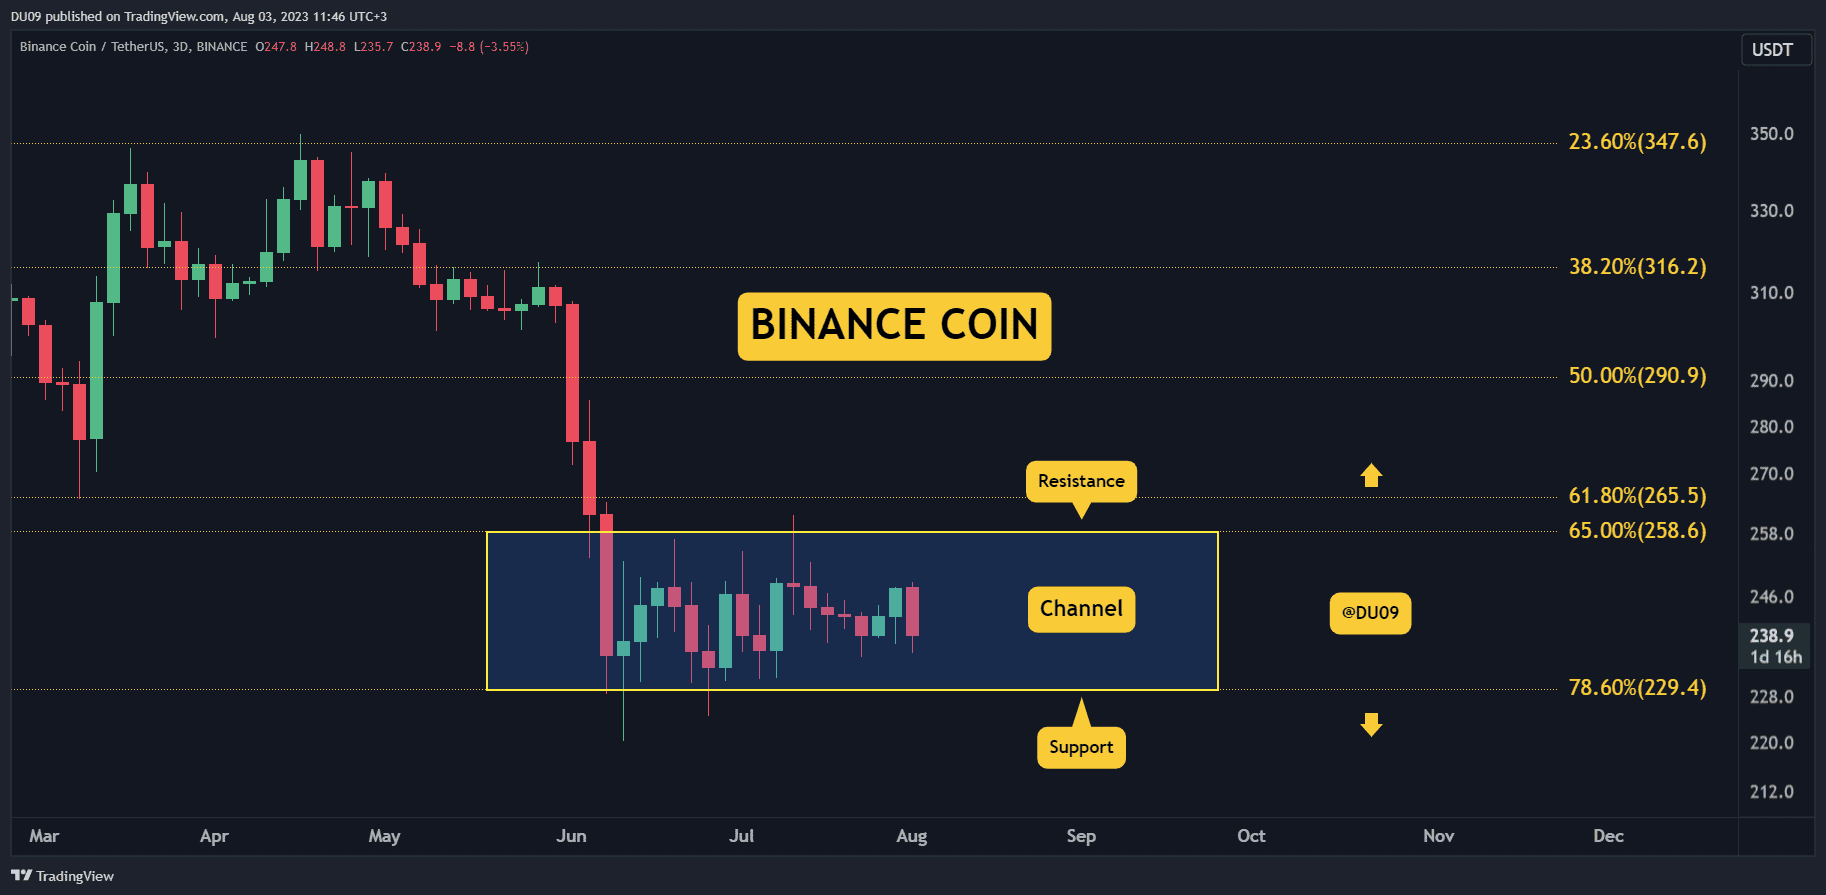
2. Sellers Could Return
This latest daily candle is a bearish engulfing one, which signals that sellers have the upper hand right now. This is not encouraging, particularly as momentum appears to shift in their favor. If so, it might be the case that the key support will be put under pressure soon.
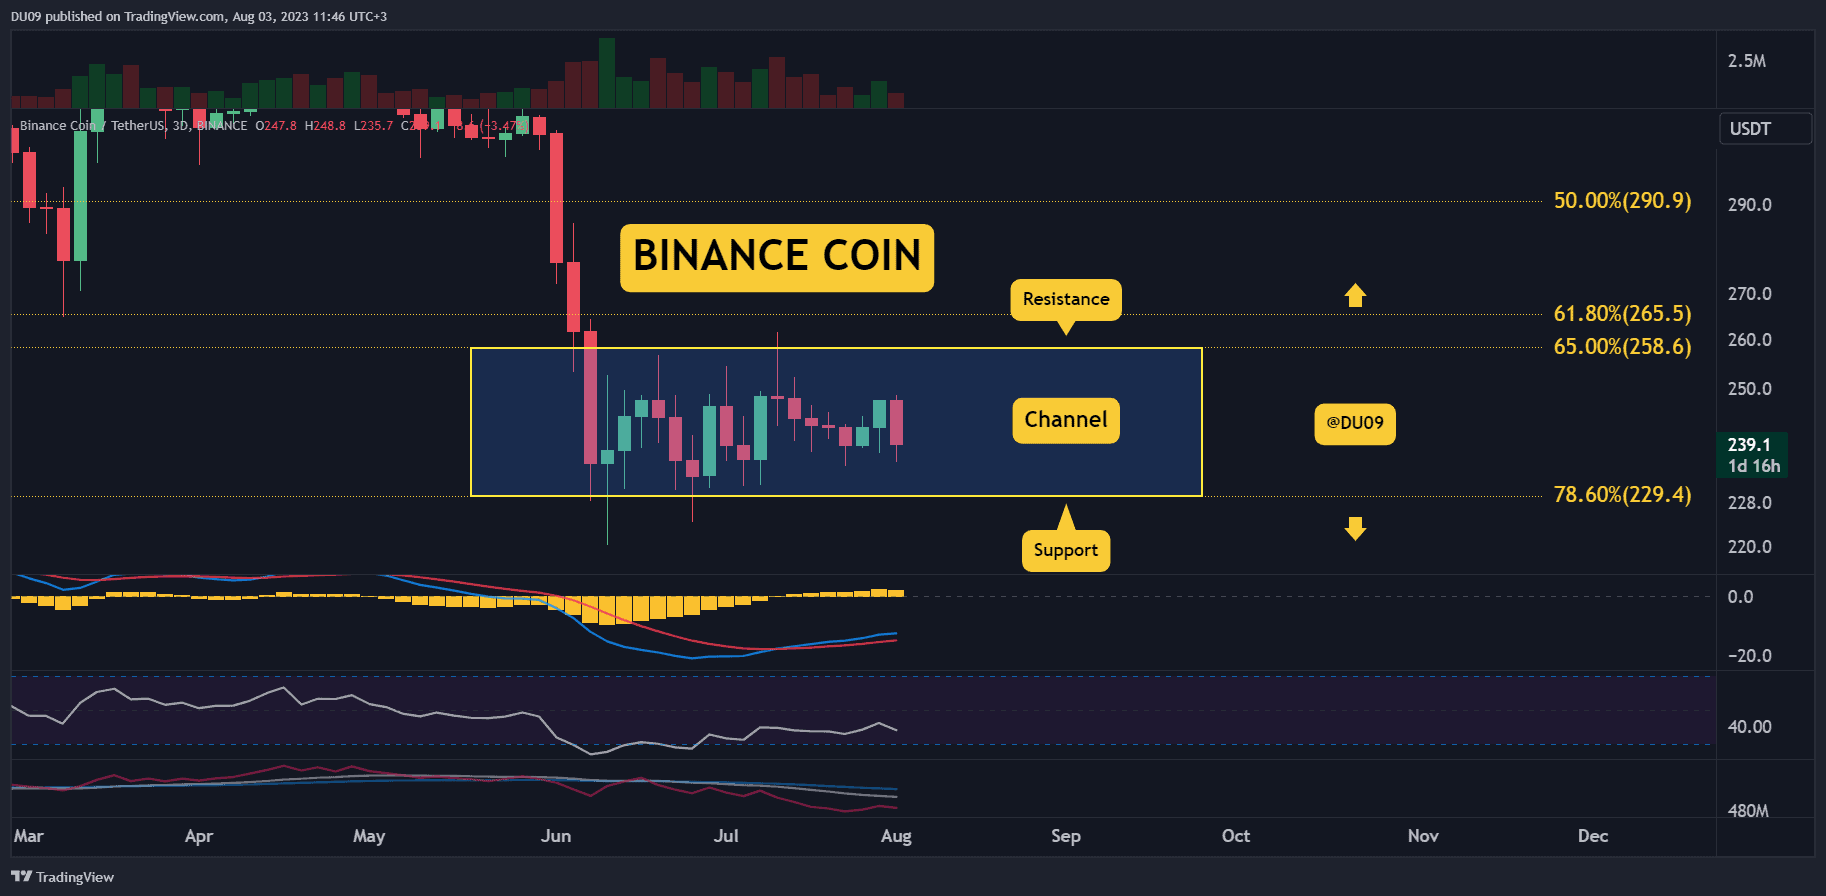
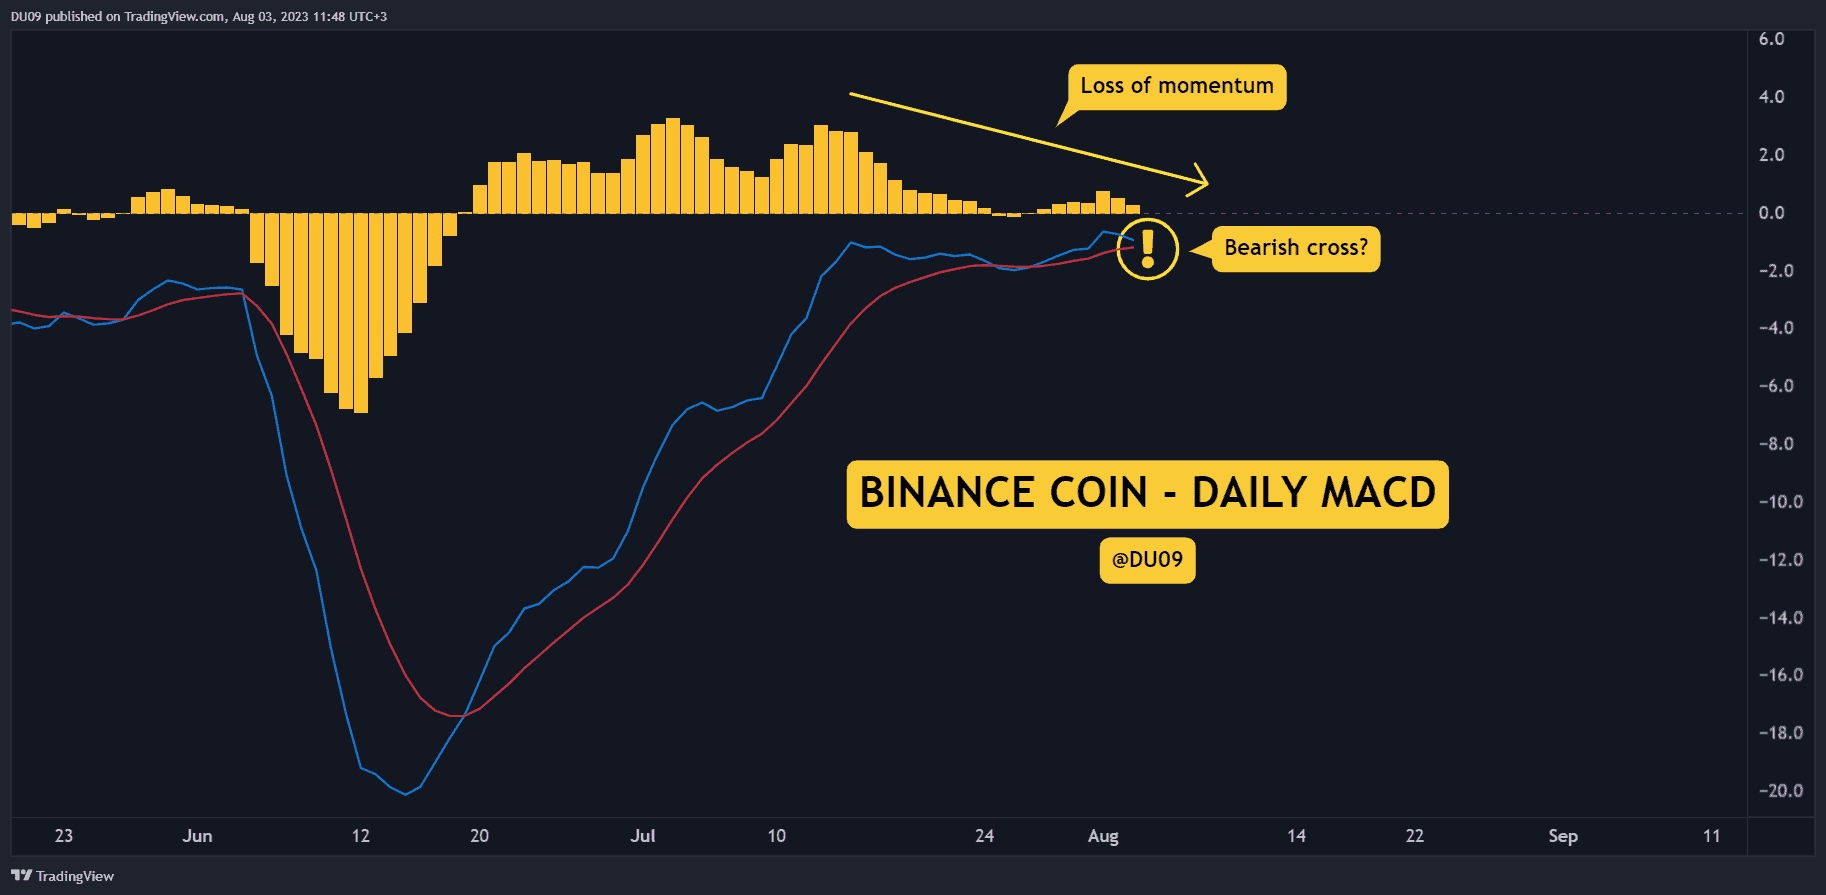
3. Bearish Cross?
The daily MACD is already giving clear signs of weakness in the price action with an imminent bearish cross if buyers don’t return. This could shift momentum and turn the chart bearish again, which would continue the downtrend that started in early June.
Bias
The bias for BNB is bearish.
Short-Term Prediction for BNB Price
The key support continues to hold, but its resilience could soon be put to the test by the bears. In case of failure there, BNB could revisit $200 in August.
The post Can BNB Hold Above $230? Here’s What You Need to Know (Binance Coin Price Analysis) appeared first on CryptoPotato.