Analysis: If History Repeats, Ethereum’s Price Can Top $2200 Next
Ethereum followed Bitcoin’s price through a correction earlier today. However, in doing so, it has also reached oversold levels on the Relative Strength Index (RSI) which are typically followed by a serious uptrend.
Ethereum’s Price Goes Through a Correction
As CryptoPotato reported earlier today, Bitcoin’s price went through a mild correction which saw it dipping below $46,000 after a rejection at the coveted $50,000 level.
Many altcoins followed and ETH was among them. The correction in ETH’s price, however, was steeper, compared to that of BTC.
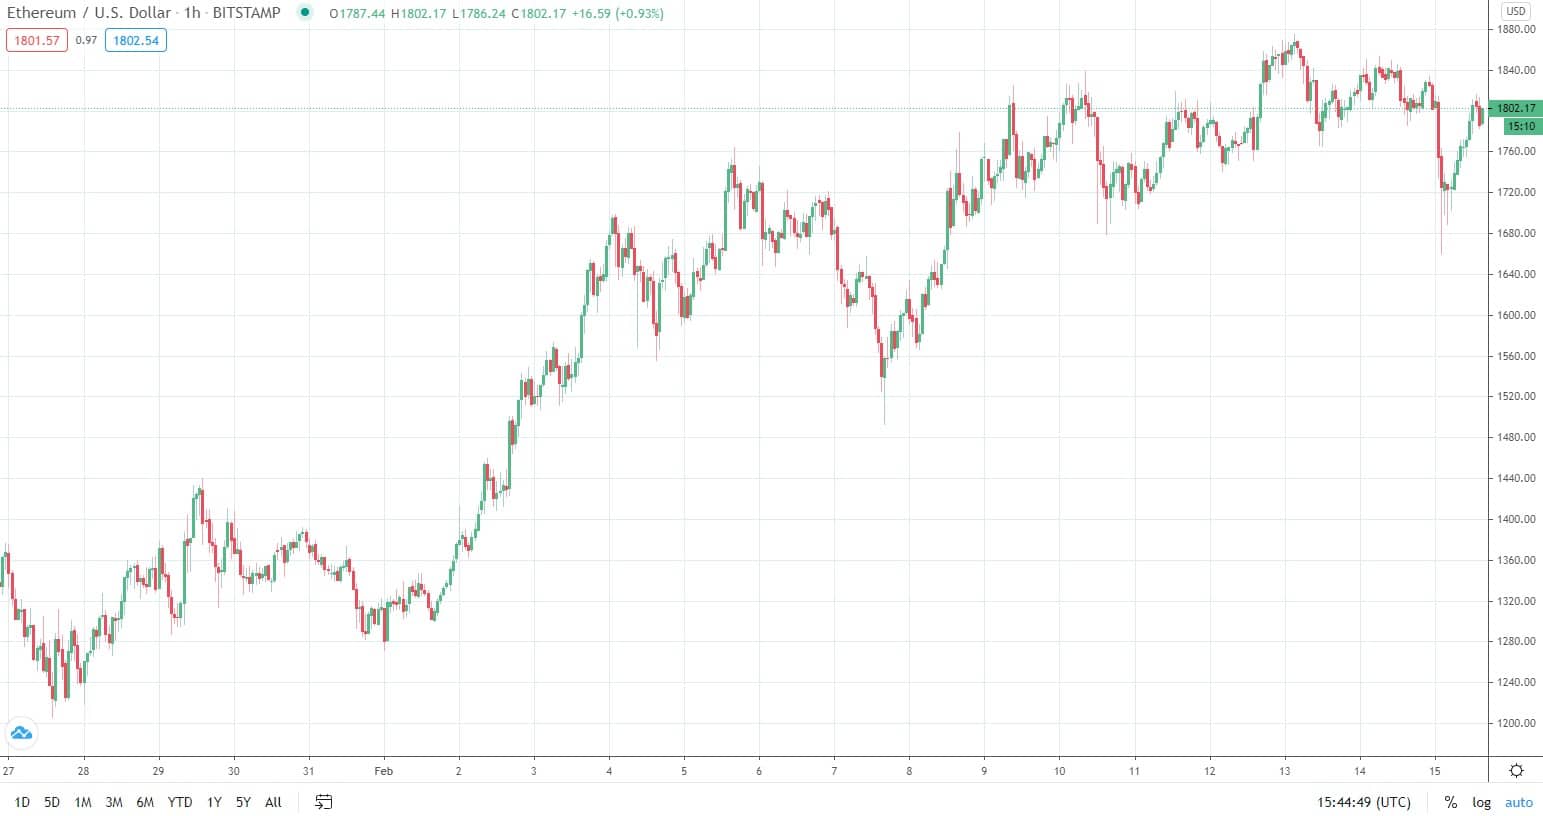
As seen in the above chart, the price dipped from around $1830 down to $1660 to chart a sudden decrease of about 9%.
Data shows that in the past 24 hours alone, around $317 million worth of both long and short ETH positions were liquidated across the major exchanges. It’s worth noting that this could be an indicator of how overly-leveraged the market has been over the past few days.
Bullish Signs Nonetheless
Regardless of the above, a look into one of the most popular technical indicators and how the price has performed historically could spell bullishness for the market.
As pointed out by a popular altcoins trader and analyst on Twitter,
Each time we’ve reached the oversold extreme on the hourly, we’ve received an average of a 37% move up. Bull market conditions running wild. If it changes, it will be a significant change in character for ETH.
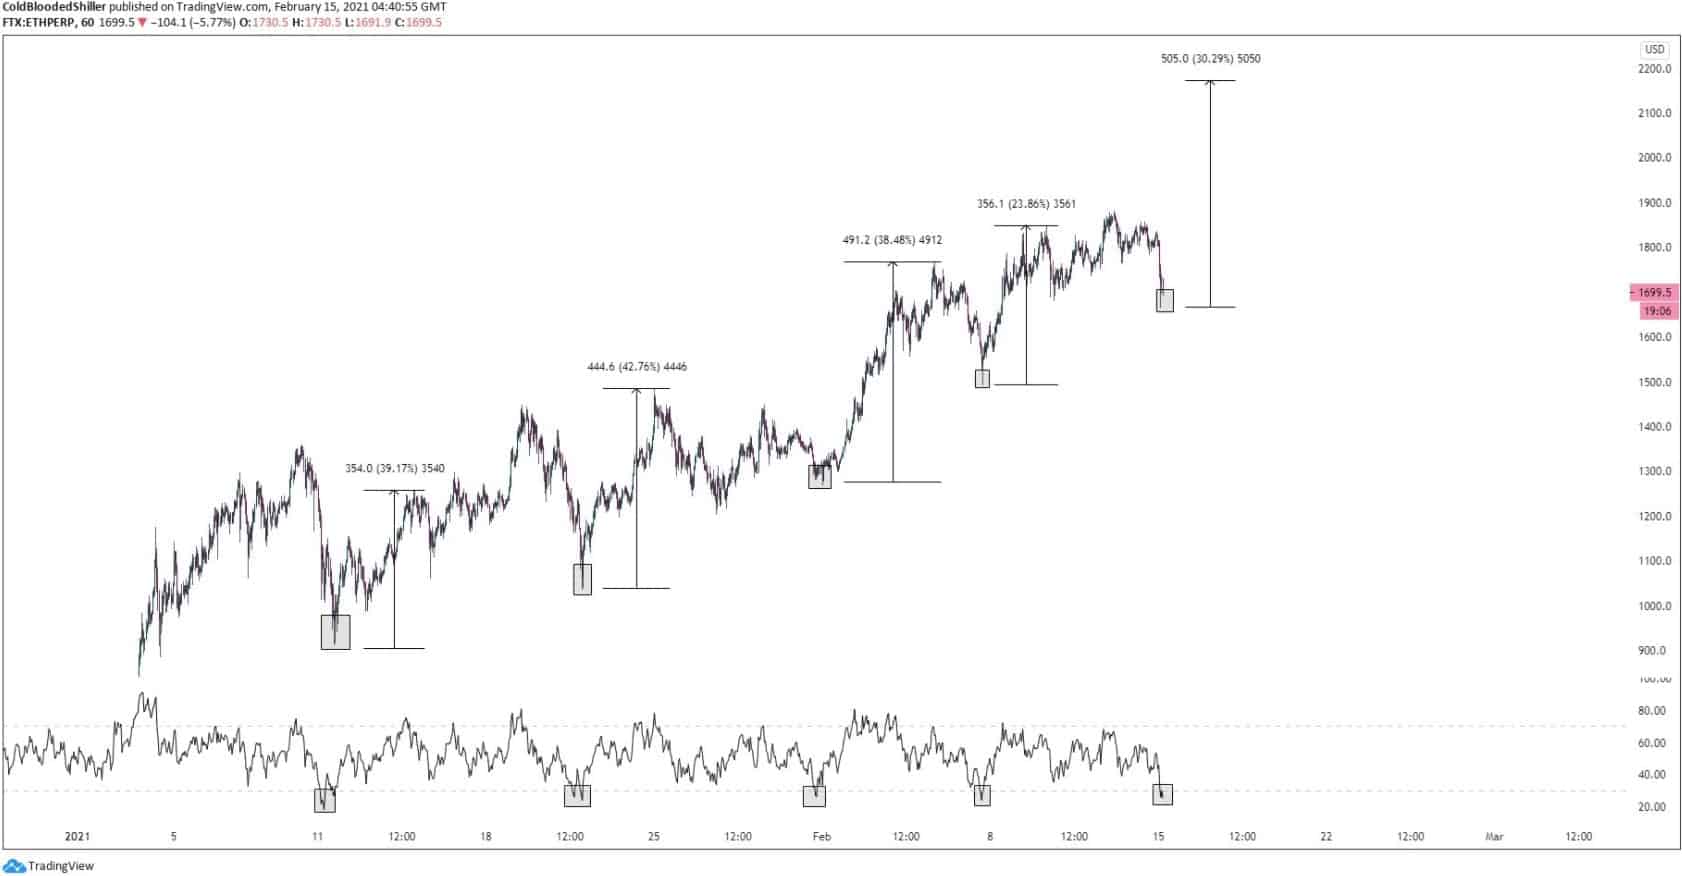
The trader makes a simple case – each time the Relative Strength Index (RSI) has dipped to extremely oversold conditions, the price has bounced by an average of 37%. This was the case earlier today when ETH dropped to $1660. If history is to repeat itself, the following cycle could see ETH top at above $2,200.
The price has already recovered about 8.5% at the time of this writing and it’s battling to conquer the $1,800 mark.
For those who are unaware, the RSI is a momentum indicator that is present in almost every technical analysis. It measures the magnitude of recent price changes with an aim to evaluate overbought or oversold conditions in the price of an asset.