Ripple Price Analysis: XRP Up 36% Weekly, Facing Huge Resistance
XRP/USD – Bulls Back On The Offensive
Key Support Levels: $0.569, $0.505, $0.453.
Key Resistance Levels: $0.609, $0.635, $0.675.
XRP managed to surge by around 36% this week as the cryptocurrency trades at $0.57. Last week, XRP pushed above a descending trend line that dated back to early December 2020. After breaking this trend line, the coin started to rally, reaching as high as $0.675 yesterday.
Unfortunately, it could not close a daily candle above $0.635 and has dropped lower today, spiking as low as $0.5 (.382 Fib). It managed to rebound from there to trade back above $0.57 (.236 Fib) support.
Undoubtedly, the first level of major resistance lies at around $0.6.
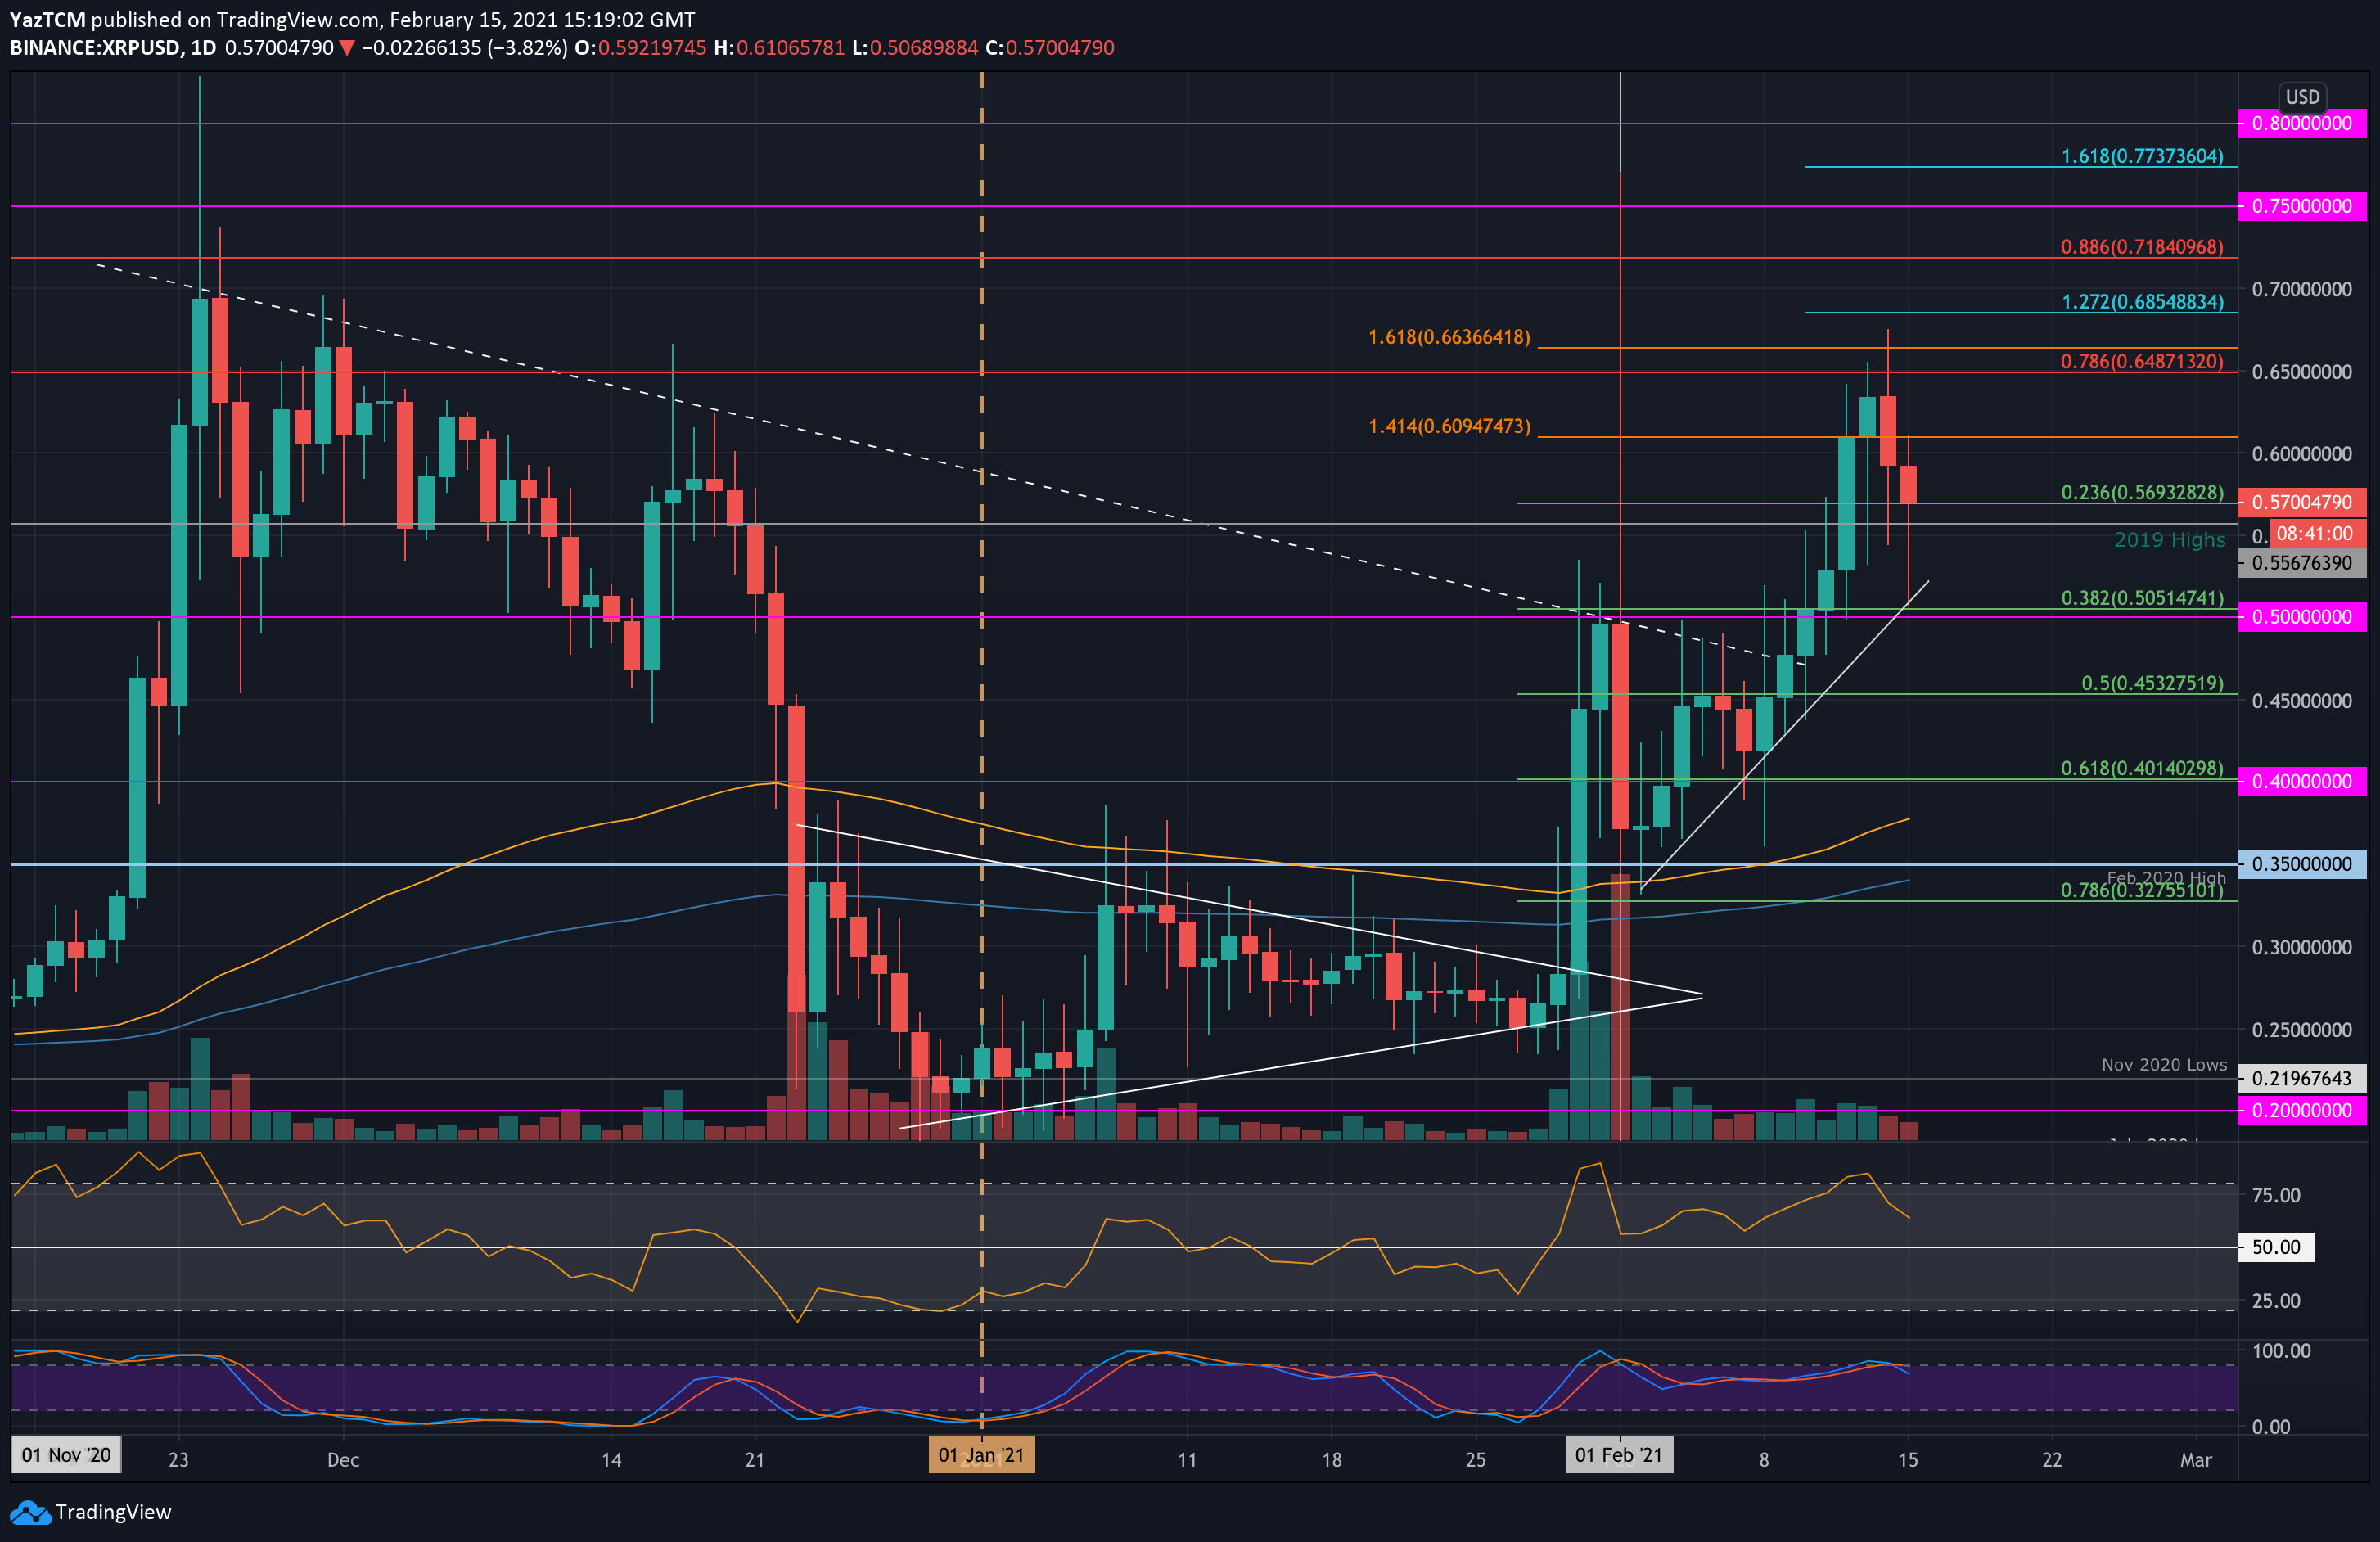
XRP-USD Short Term Price Prediction
Looking ahead, the first resistance lies at $0.609 (1.414 Fib Extension). This is followed by $0.635, $0.675 (yesterday’s high), and $0.685 (1.272 Fib Extension). Additional resistance lies at $0.718 (bearish .886 Fib), $0.75, and $0.77 (1.618 Fib Extension).
On the other side, the first support lies at $0.569 (.237 Fib). This is followed by $0.505 (.382 Fib), $0.453 (.5 Fib), and $0.4 (.618 Fib).
The RSI is dropping, indicating fading bullish momentum. However, it is still well above the midline, which suggests the bulls are still in charge.
XRP/BTC – Bulls Trading Inside Symmetrical Triangle Pattern
Key Support Levels: 1000 SAT, 980 SAT, 867 SAT.
Key Resistance Levels: 1472 SAT, 1550 SAT, 1800 SAT.
Against Bitcoin, XRP managed to rebound from the 980 SAT (.786 Fib) support last week as it surged into 1300 SAT over the weekend. It has dropped lower today and is battling to stay above 1200 SAT (December 2017 Lows).
It has now formed a symmetrical triangle pattern, and the breakout direction of this triangle will determine where XRP will head next.
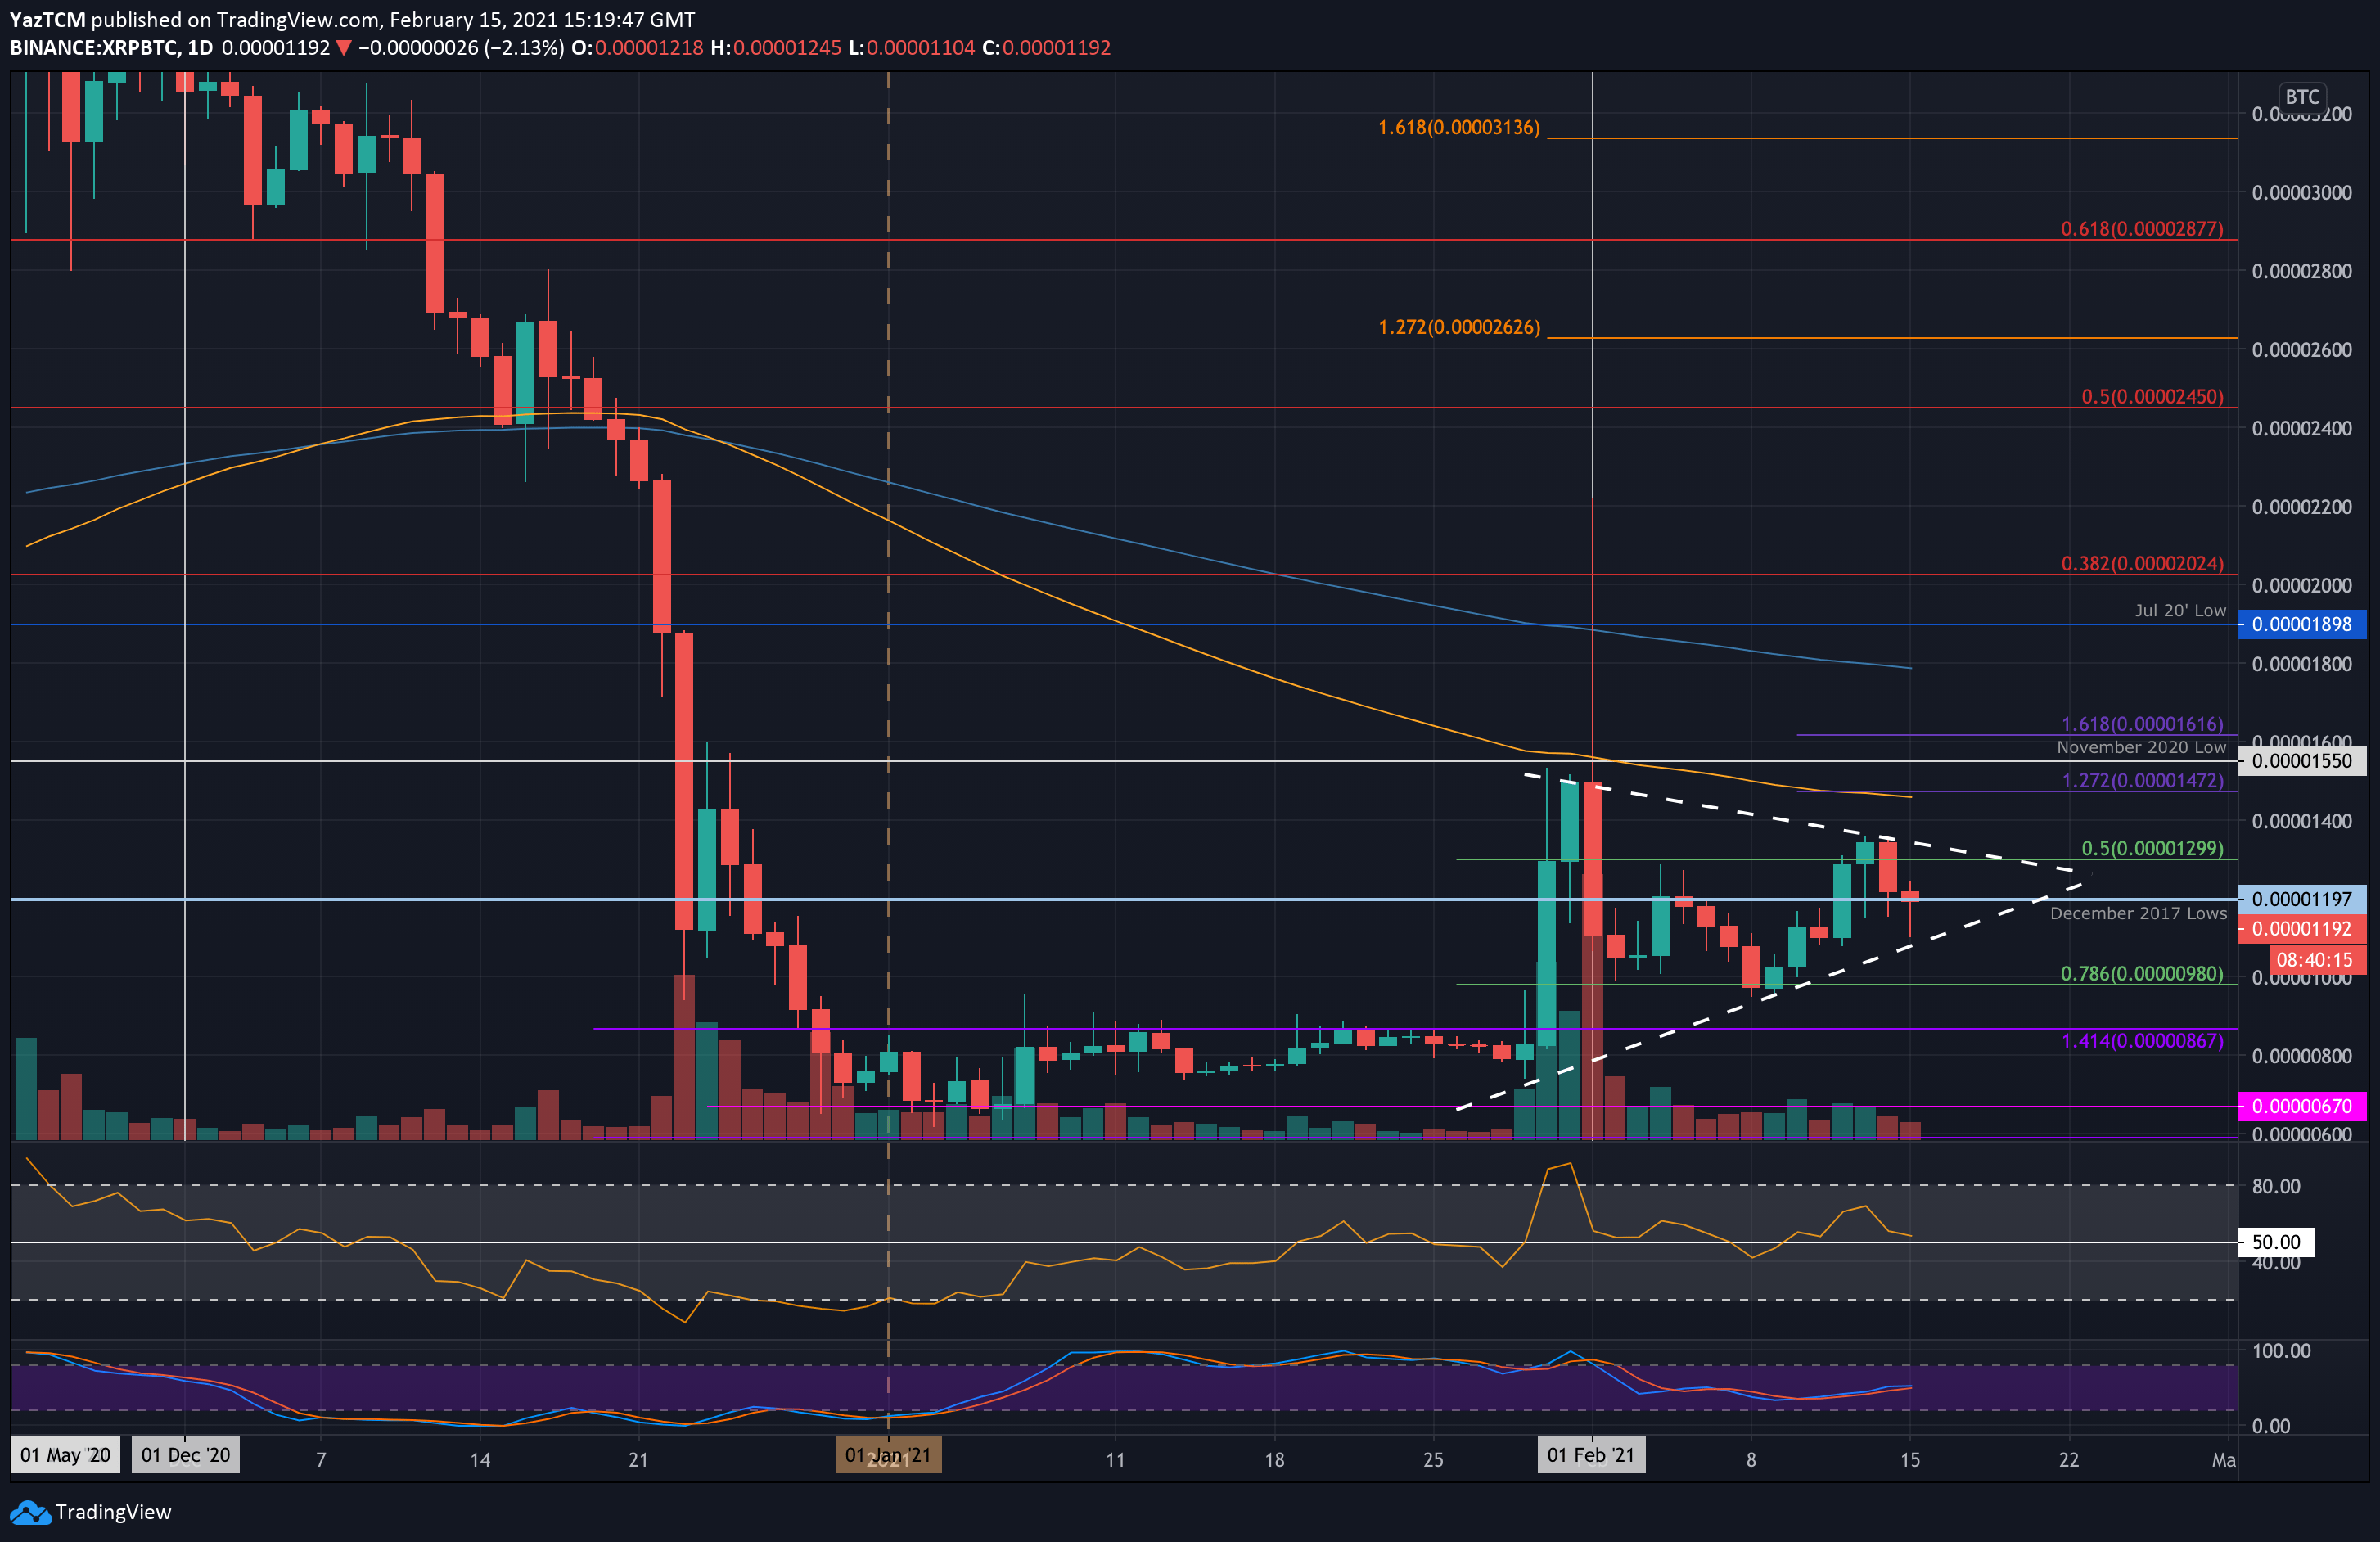
XRP-BTC Short Term Price Prediction
Moving forward, the first resistance lies at the upper angle of the triangle. This is followed by 1472 SAT (1.414 Fib Extension & 100-days EMA), 1550 SAT (November 2020 Lows), and 1800 SAT (200-days EMA).
On the other side, the first support lies at the lower angle of the triangle. This is followed by 1000 SAT, 980 SAT (.786 Fib), and 867 SAT.
The RSI is at the midline, indicating indecision between the bulls and bears. If it can rise higher from the midline, XRP can be expected to break toward the upside of the triangle with the increased momentum.