Will Ethereum Bulls Manage to Keep the Price Above $3K? (ETH Price Analysis)
Ethereum’s price has encountered challenges in breaking below the critical $3K support region, with selling pressure being met by sufficient demand, resulting in sideways consolidation. However, a sudden breach of this pivotal juncture could trigger a cascading effect.
Technical Analysis
By Shayan
The Daily Chart
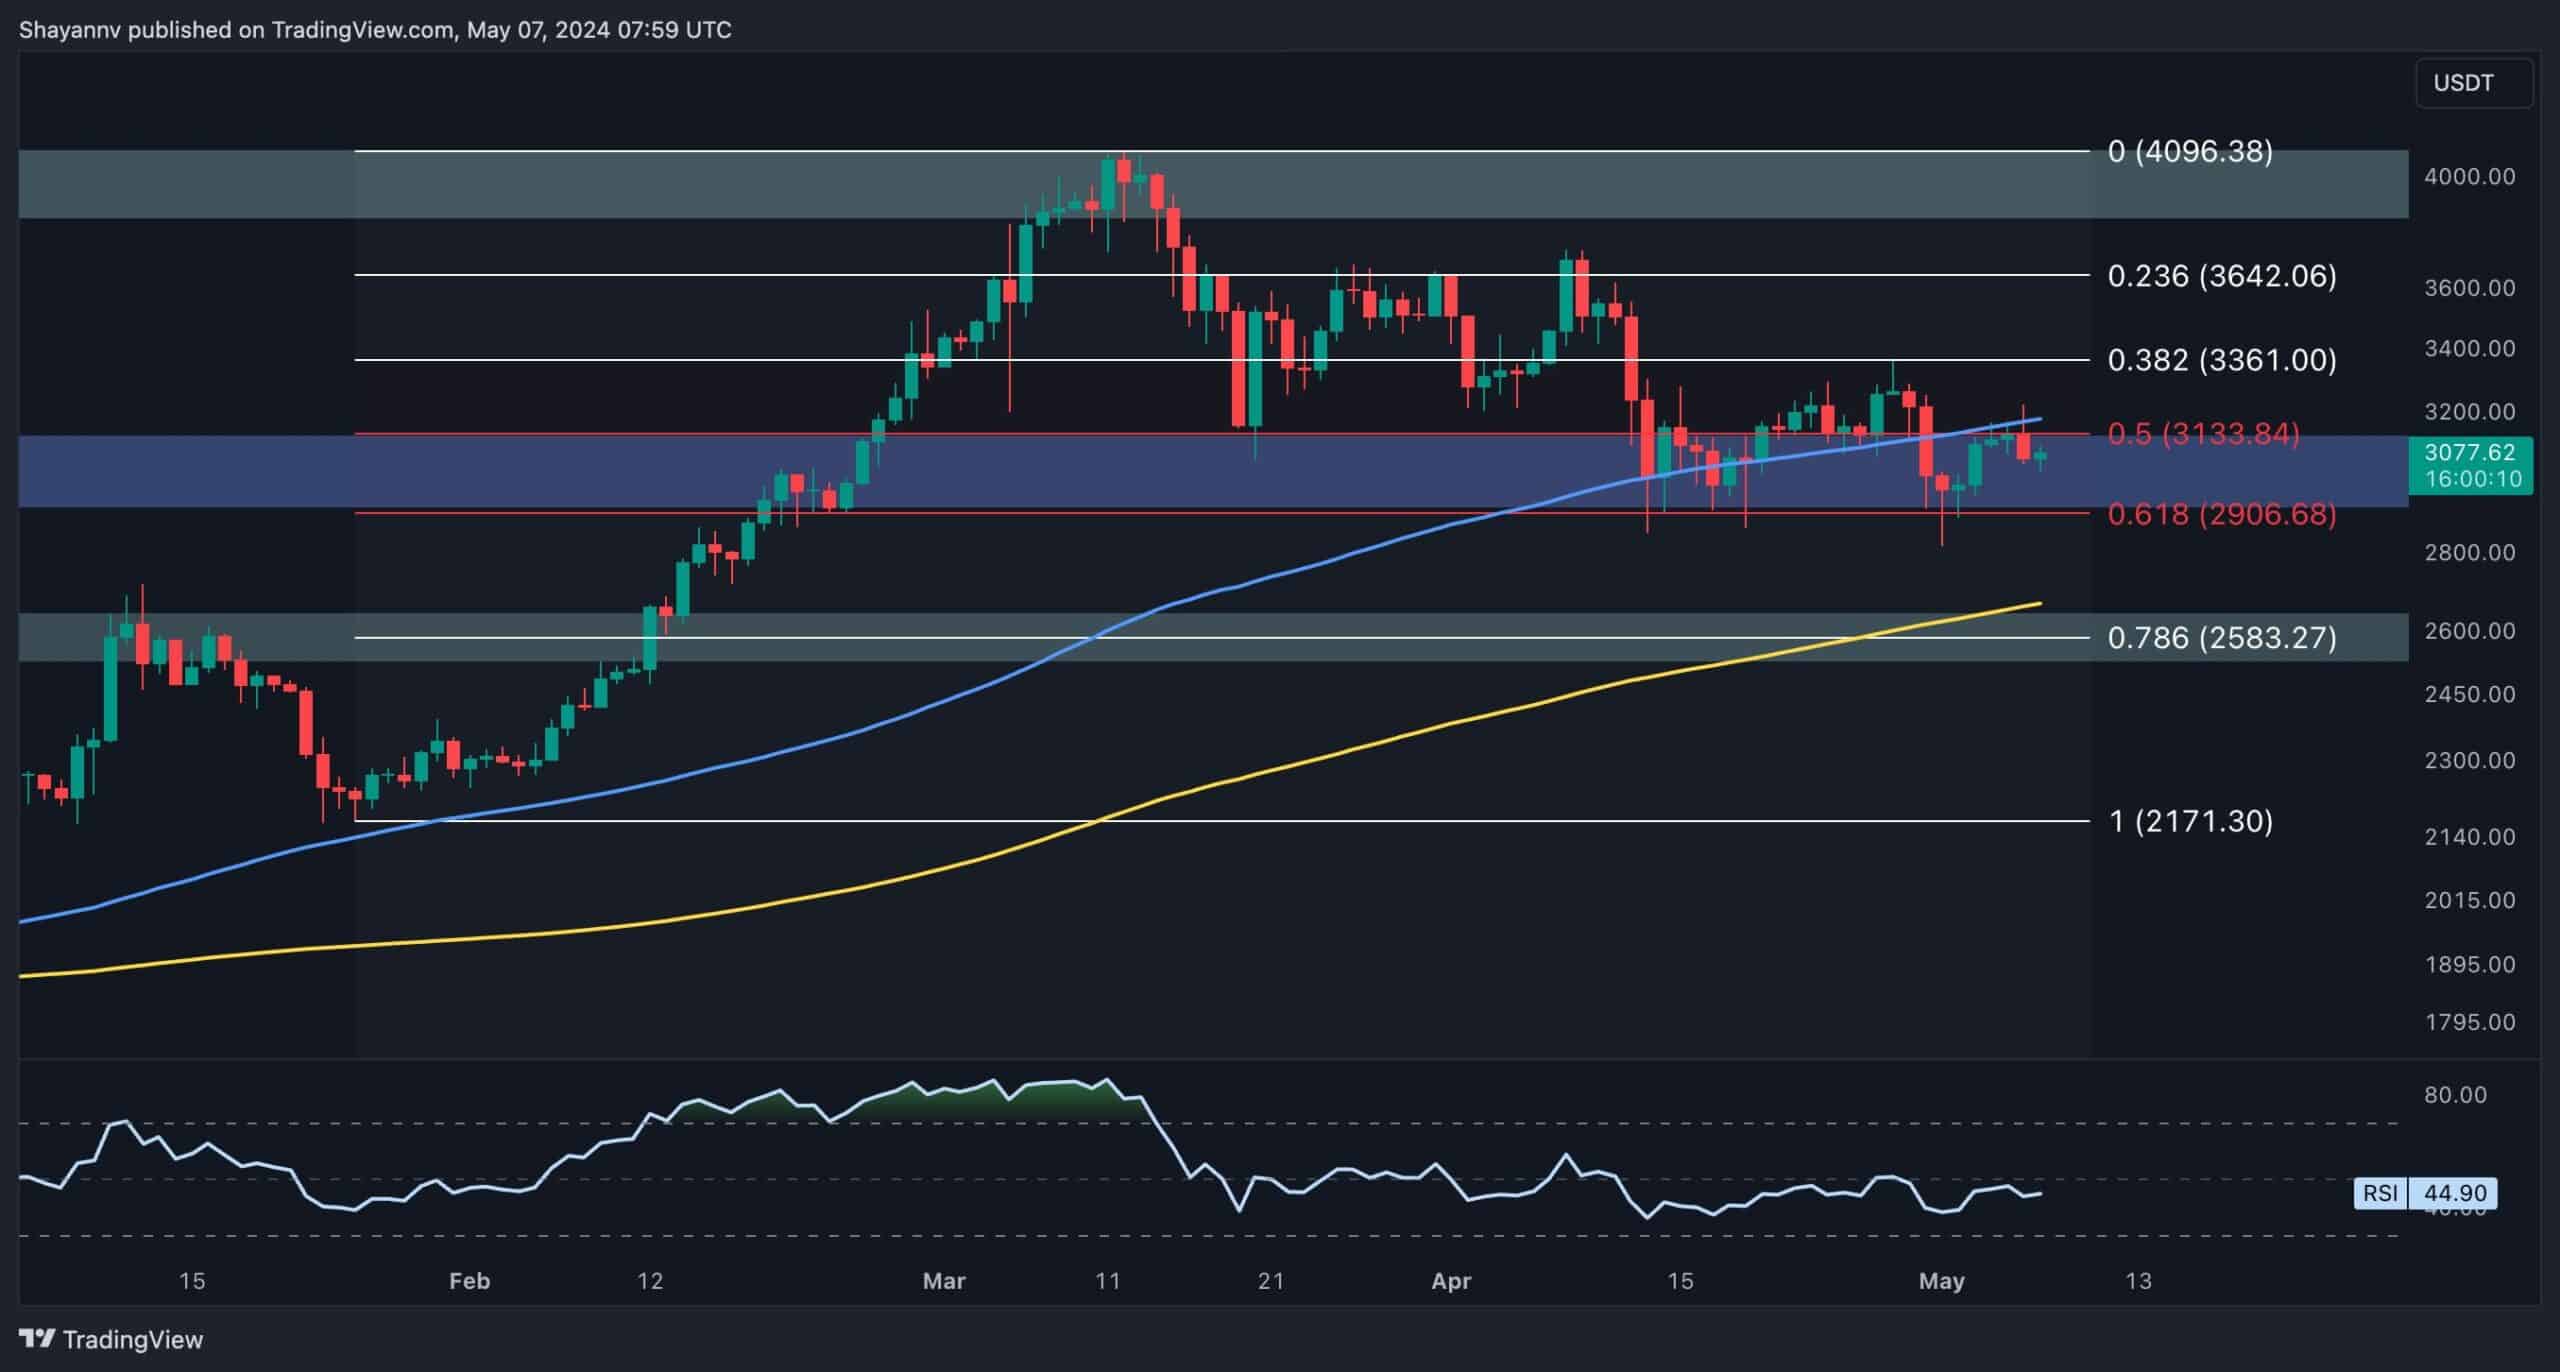
Upon examining the daily chart, Ethereum’s trajectory has turned bearish following a notable rejection near the $4K mark, fostering a bearish sentiment among market participants.
Nonetheless, the decline found a temporary recess upon reaching a substantial support region, encompassing the crucial $3K mark and the price range between the 0.5 ($3133) and 0.618 ($2906) Fibonacci levels. This support area aligns closely with the critical 100-day moving average, indicating significant demand near this crucial threshold.
Currently, Ethereum is experiencing a sideways consolidation phase, with the price hovering around the significant $3K support region. This suggests possible accumulation underway, potentially paving the way for a robust bullish resurgence in the short term. However, an unexpected breach of this crucial support zone could trigger a cascade effect, with the next target situated at the $2.5K region and the 200-day moving average of $2.6K.
The 4-Hour Chart
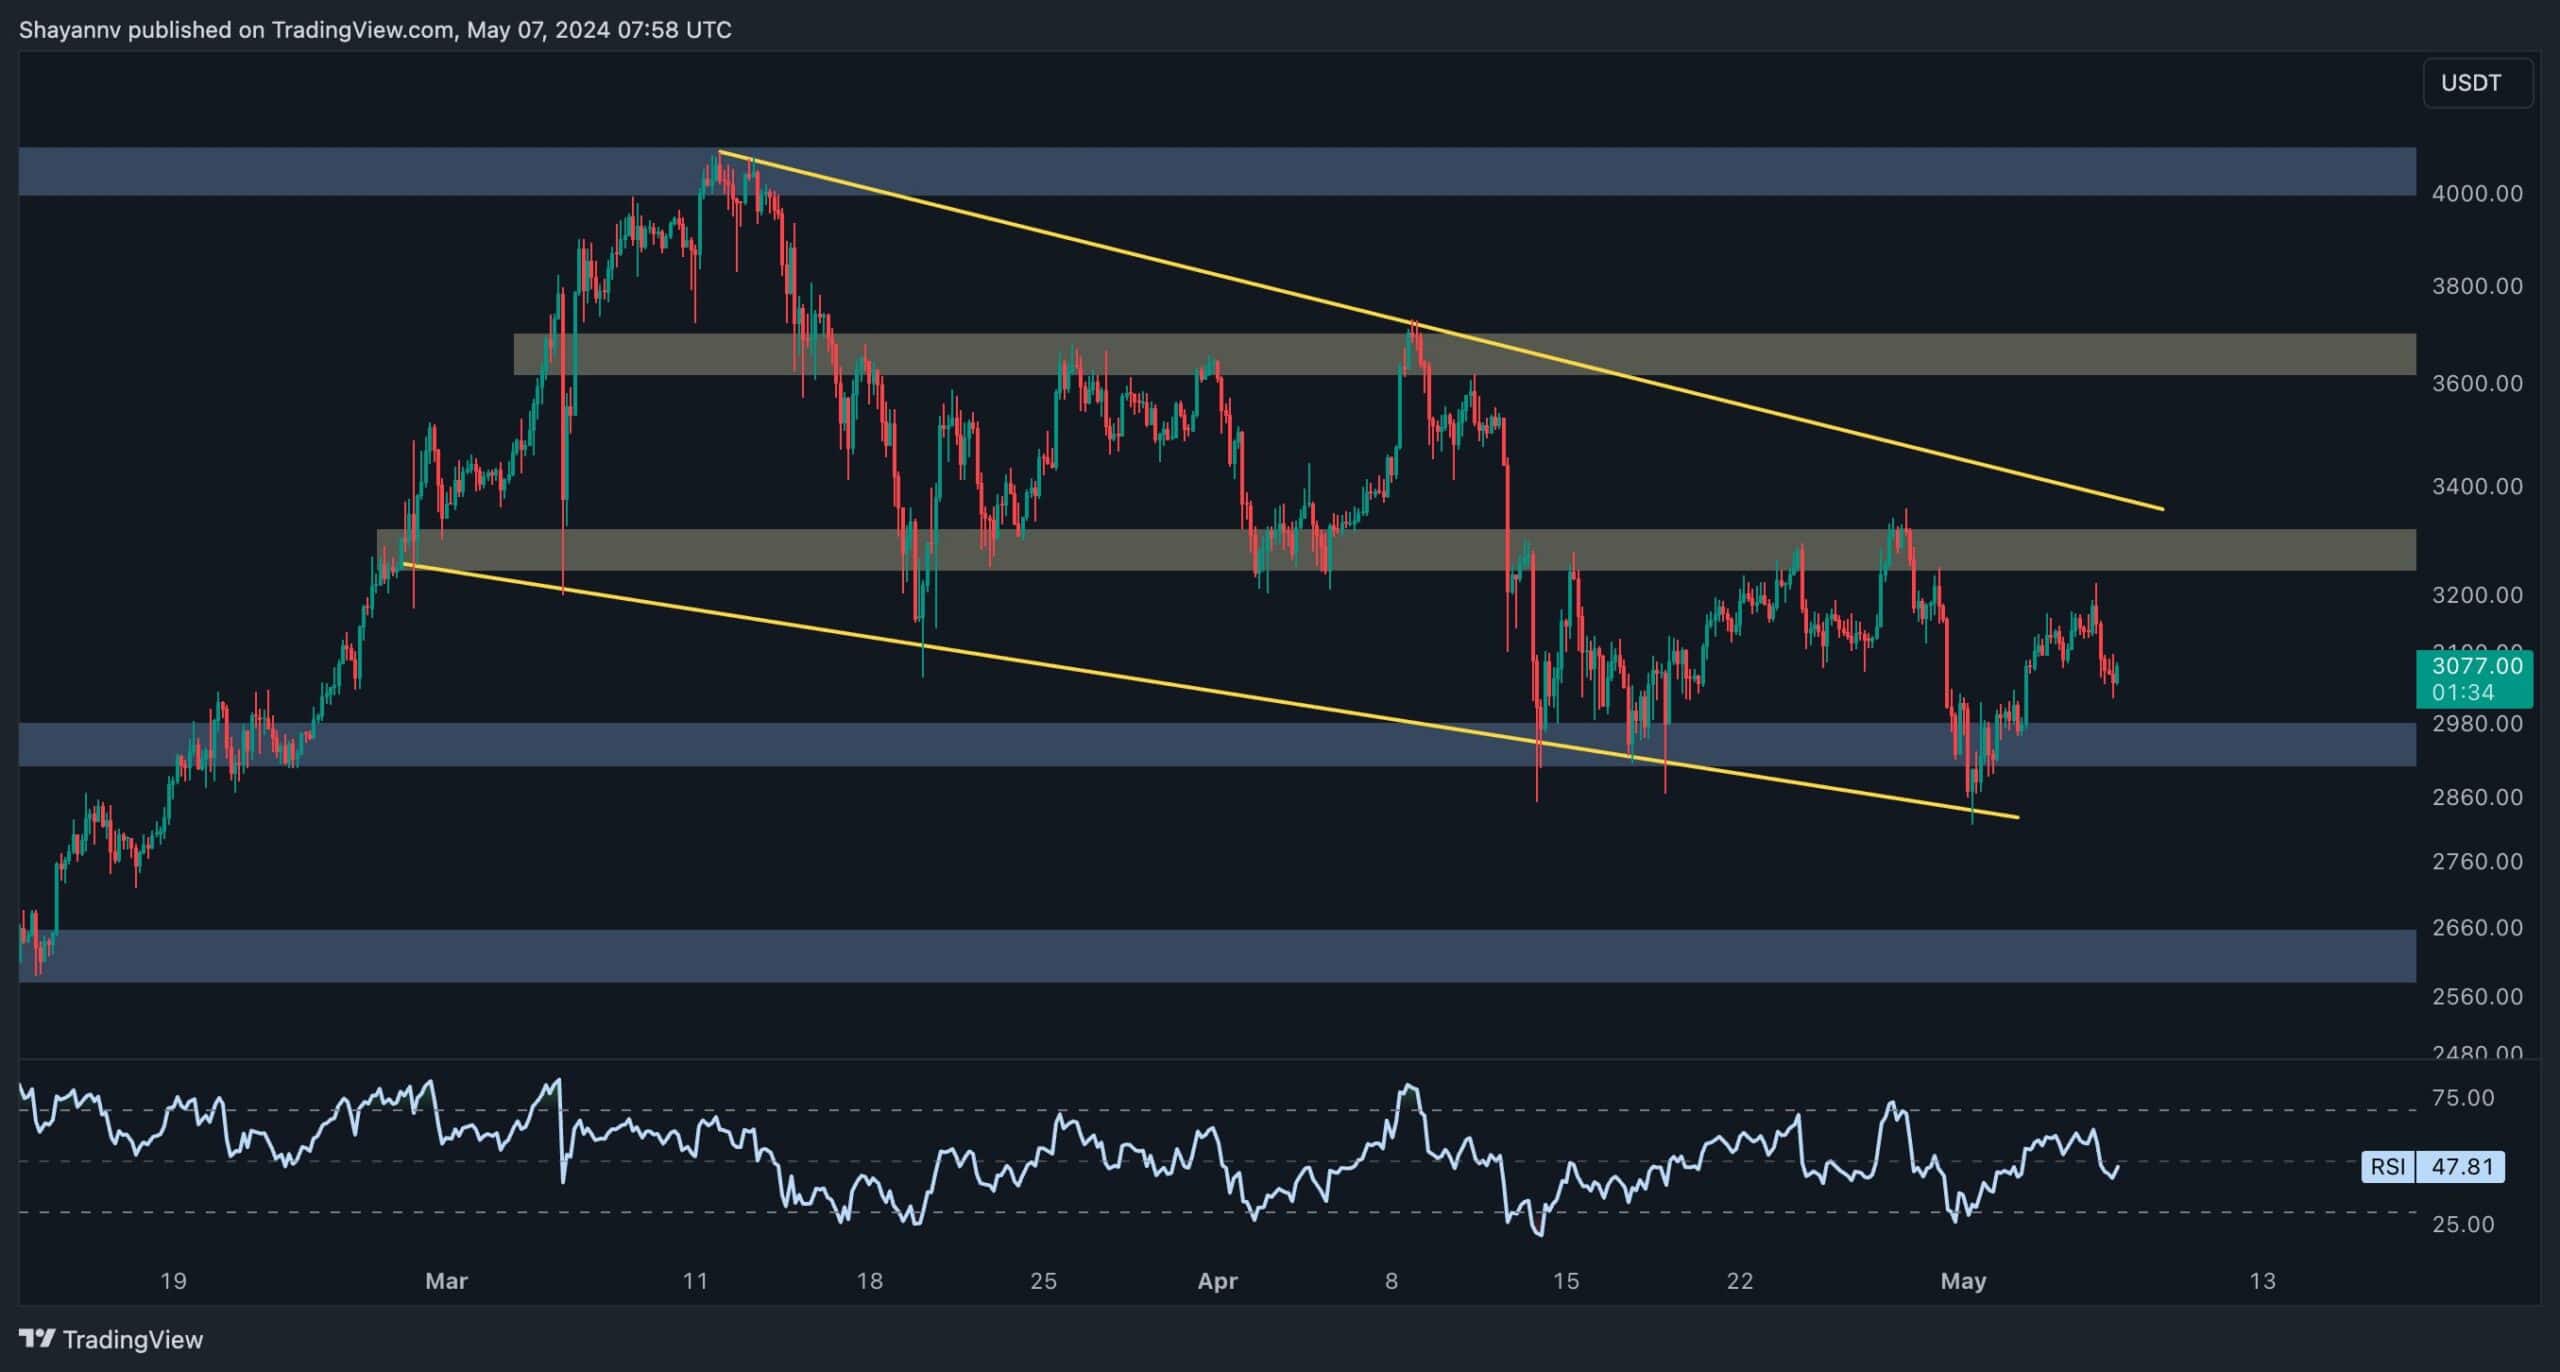
Analysis of the 4-hour chart reveals that Ethereum’s multi-month decline has led to the formation of a descending wedge pattern, with the price finding support from the pattern’s lower boundary on multiple occasions.
Presently, Ethereum is seeing sideways movement near the lower boundary of the wedge pattern, corresponding to the $3K support region, indicating heightened buying pressure in the market.
Despite this, the cryptocurrency seems poised to continue its consolidation within the price range bounded by the $3.4K resistance region and the $3K support. Given recent price action and prevailing market sentiment, there is an expectation for the price to successfully break above this decisive range, potentially culminating in a renewed bullish trend toward the $3.6K threshold.
Sentiment Analysis
By Shayan
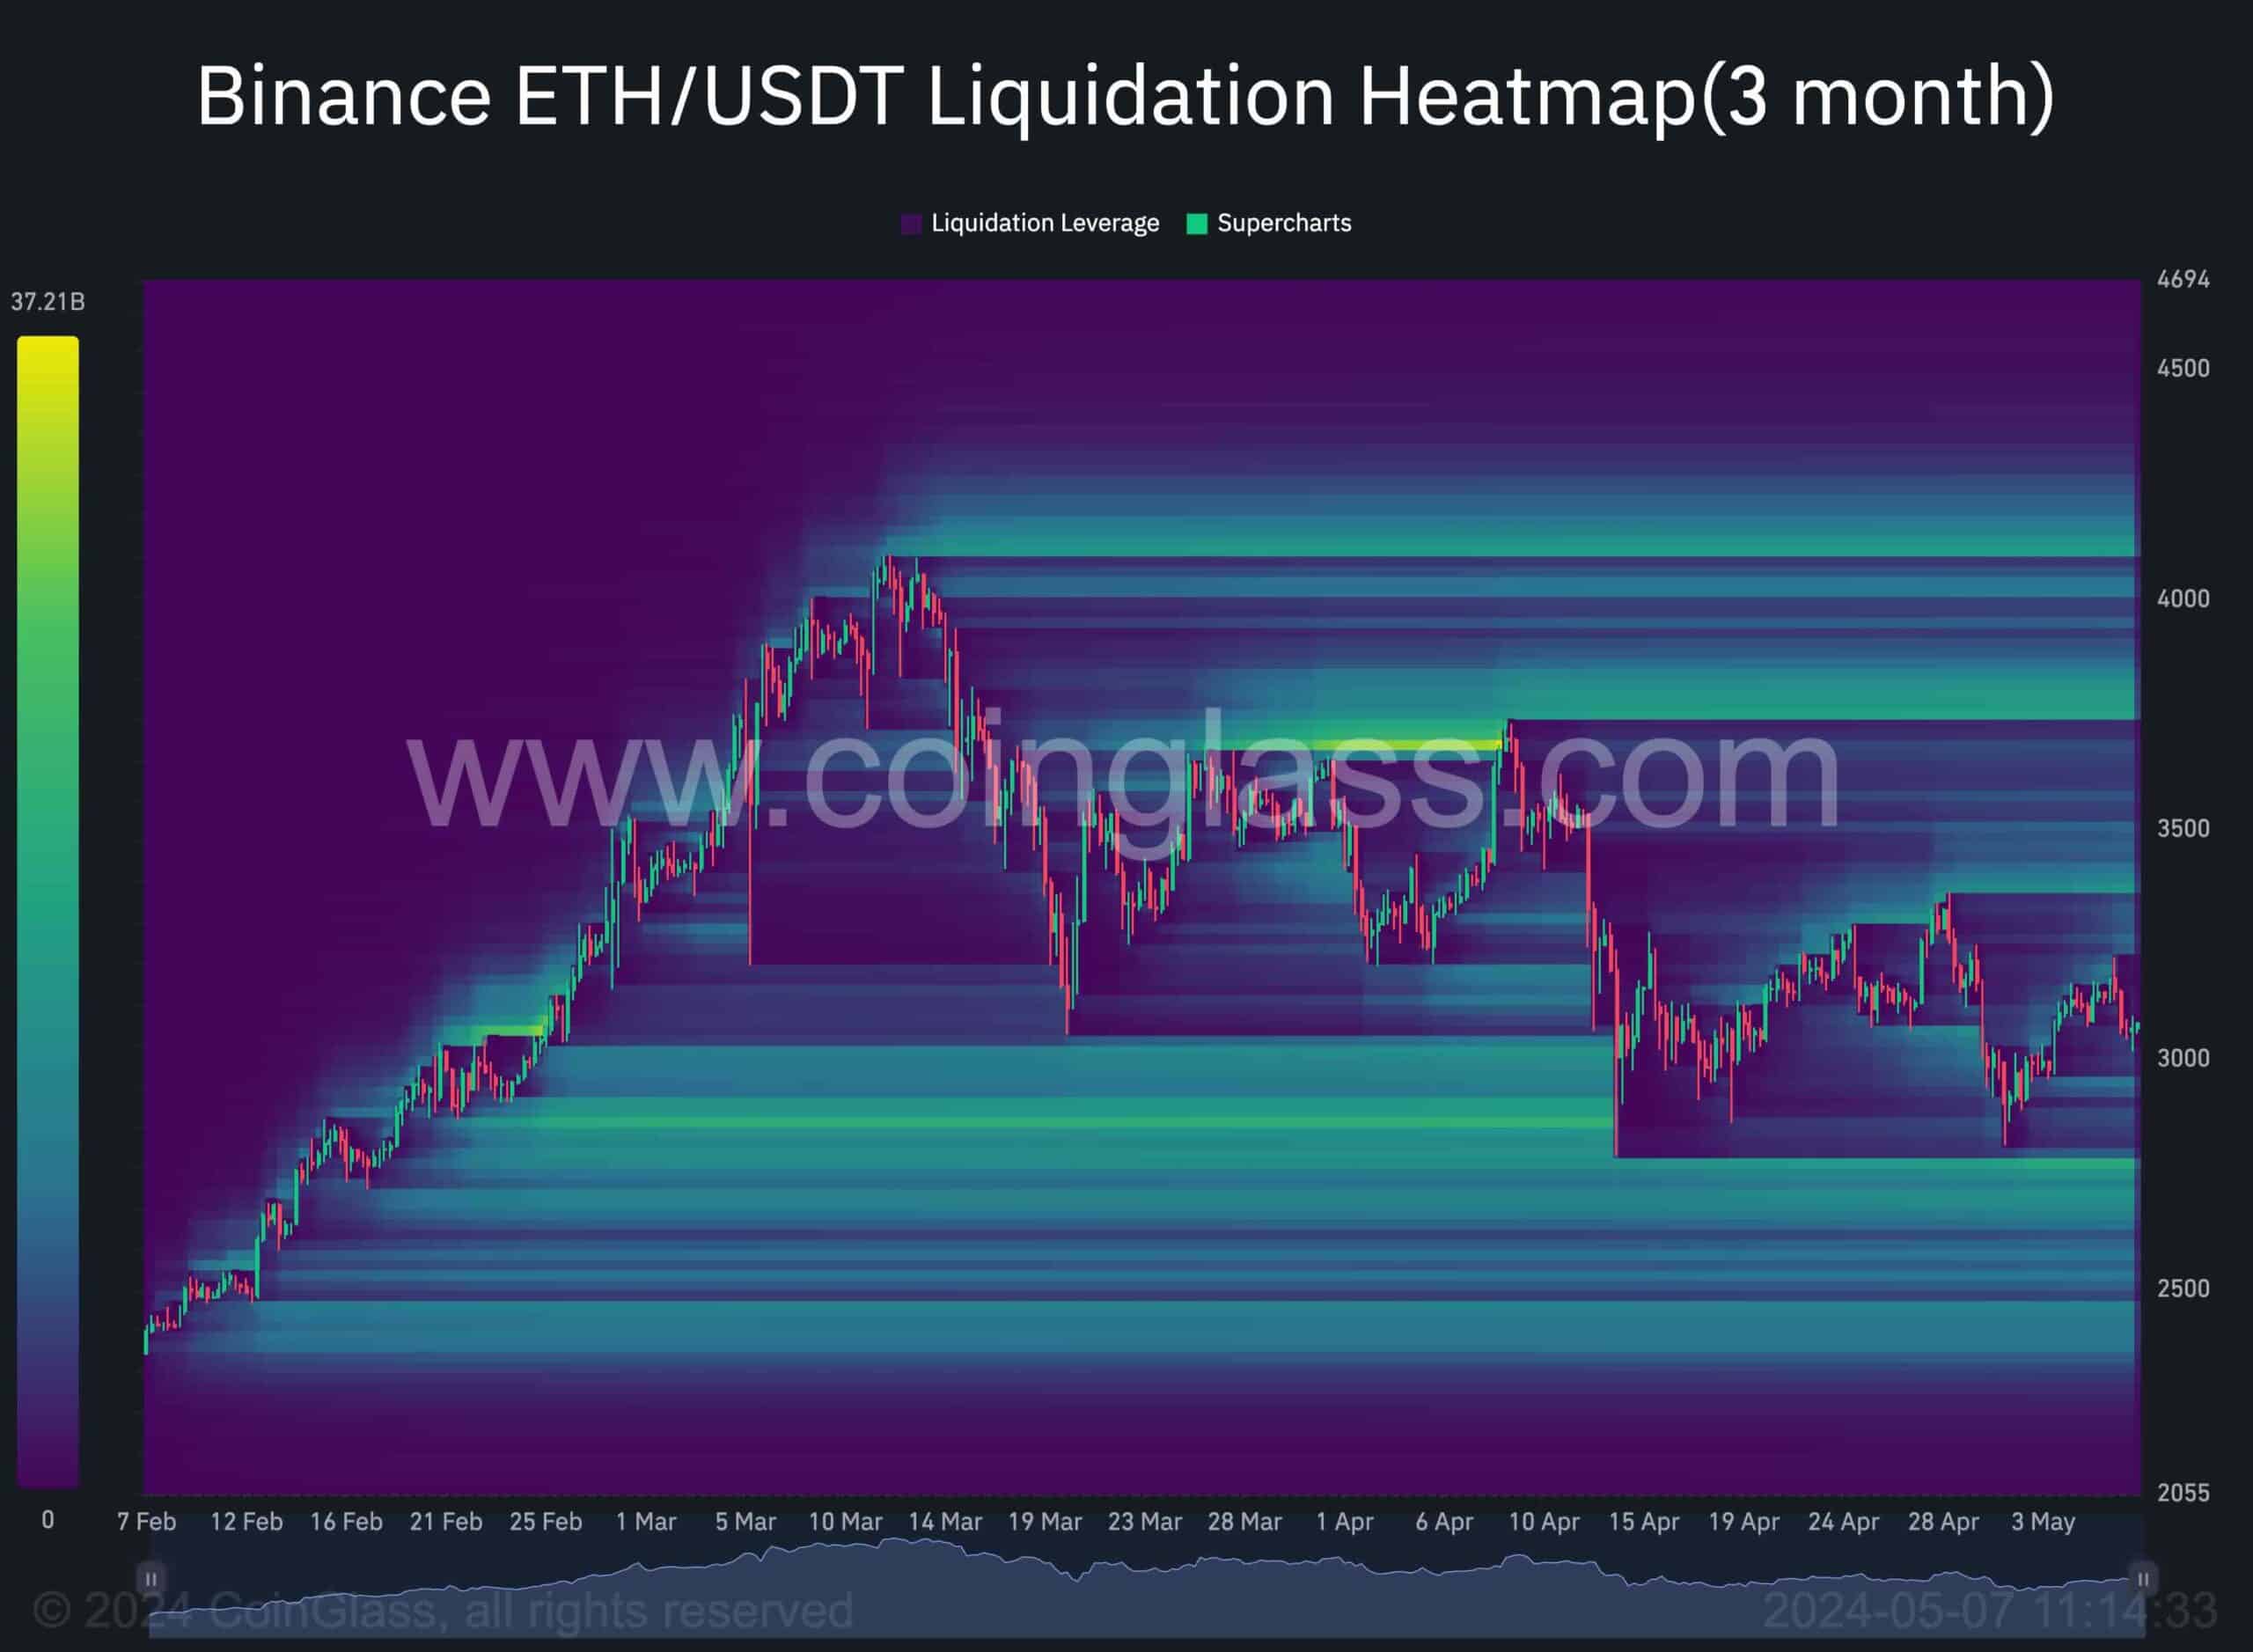
Amidst Ethereum’s multi-month downtrend, initiated by its rejection near the $4K mark, investors are closely monitoring the behavior of traders in the futures market. The provided chart displays the liquidation heatmap for the Binance ETH/USDT pair, highlighting price levels with significant liquidity capable of impacting the price trend.
It’s apparent that the sudden drop below the critical $3K level resulted in the liquidation of a substantial number of long positions, triggering a cascade of sell-stop orders. However, since then, the price has been hovering around the crucial and psychological $3K support region, potentially signaling an accumulation stage in the market.
Considering the potential demand near this pivotal threshold, it’s anticipated that the price will initiate a fresh, bullish move once the accumulation stage concludes. Traders should monitor price action around the $3K level, as a sudden breach below this crucial mark could potentially trigger a cascade effect towards the $2.5K threshold.
The post Will Ethereum Bulls Manage to Keep the Price Above $3K? (ETH Price Analysis) appeared first on CryptoPotato.