XRP Crashes 7% as Market Turns Red, What’s Next? (Ripple Price Analysis)
Ripple faced strong rejection when attempting to breach the significant resistance region at $0.55.
Currently, it’s challenging to identify Ripple’s direction due to the choppy price action. The most likely scenario seems to be a consolidation phase for the mid-term.
Technical Analysis
By Shayan
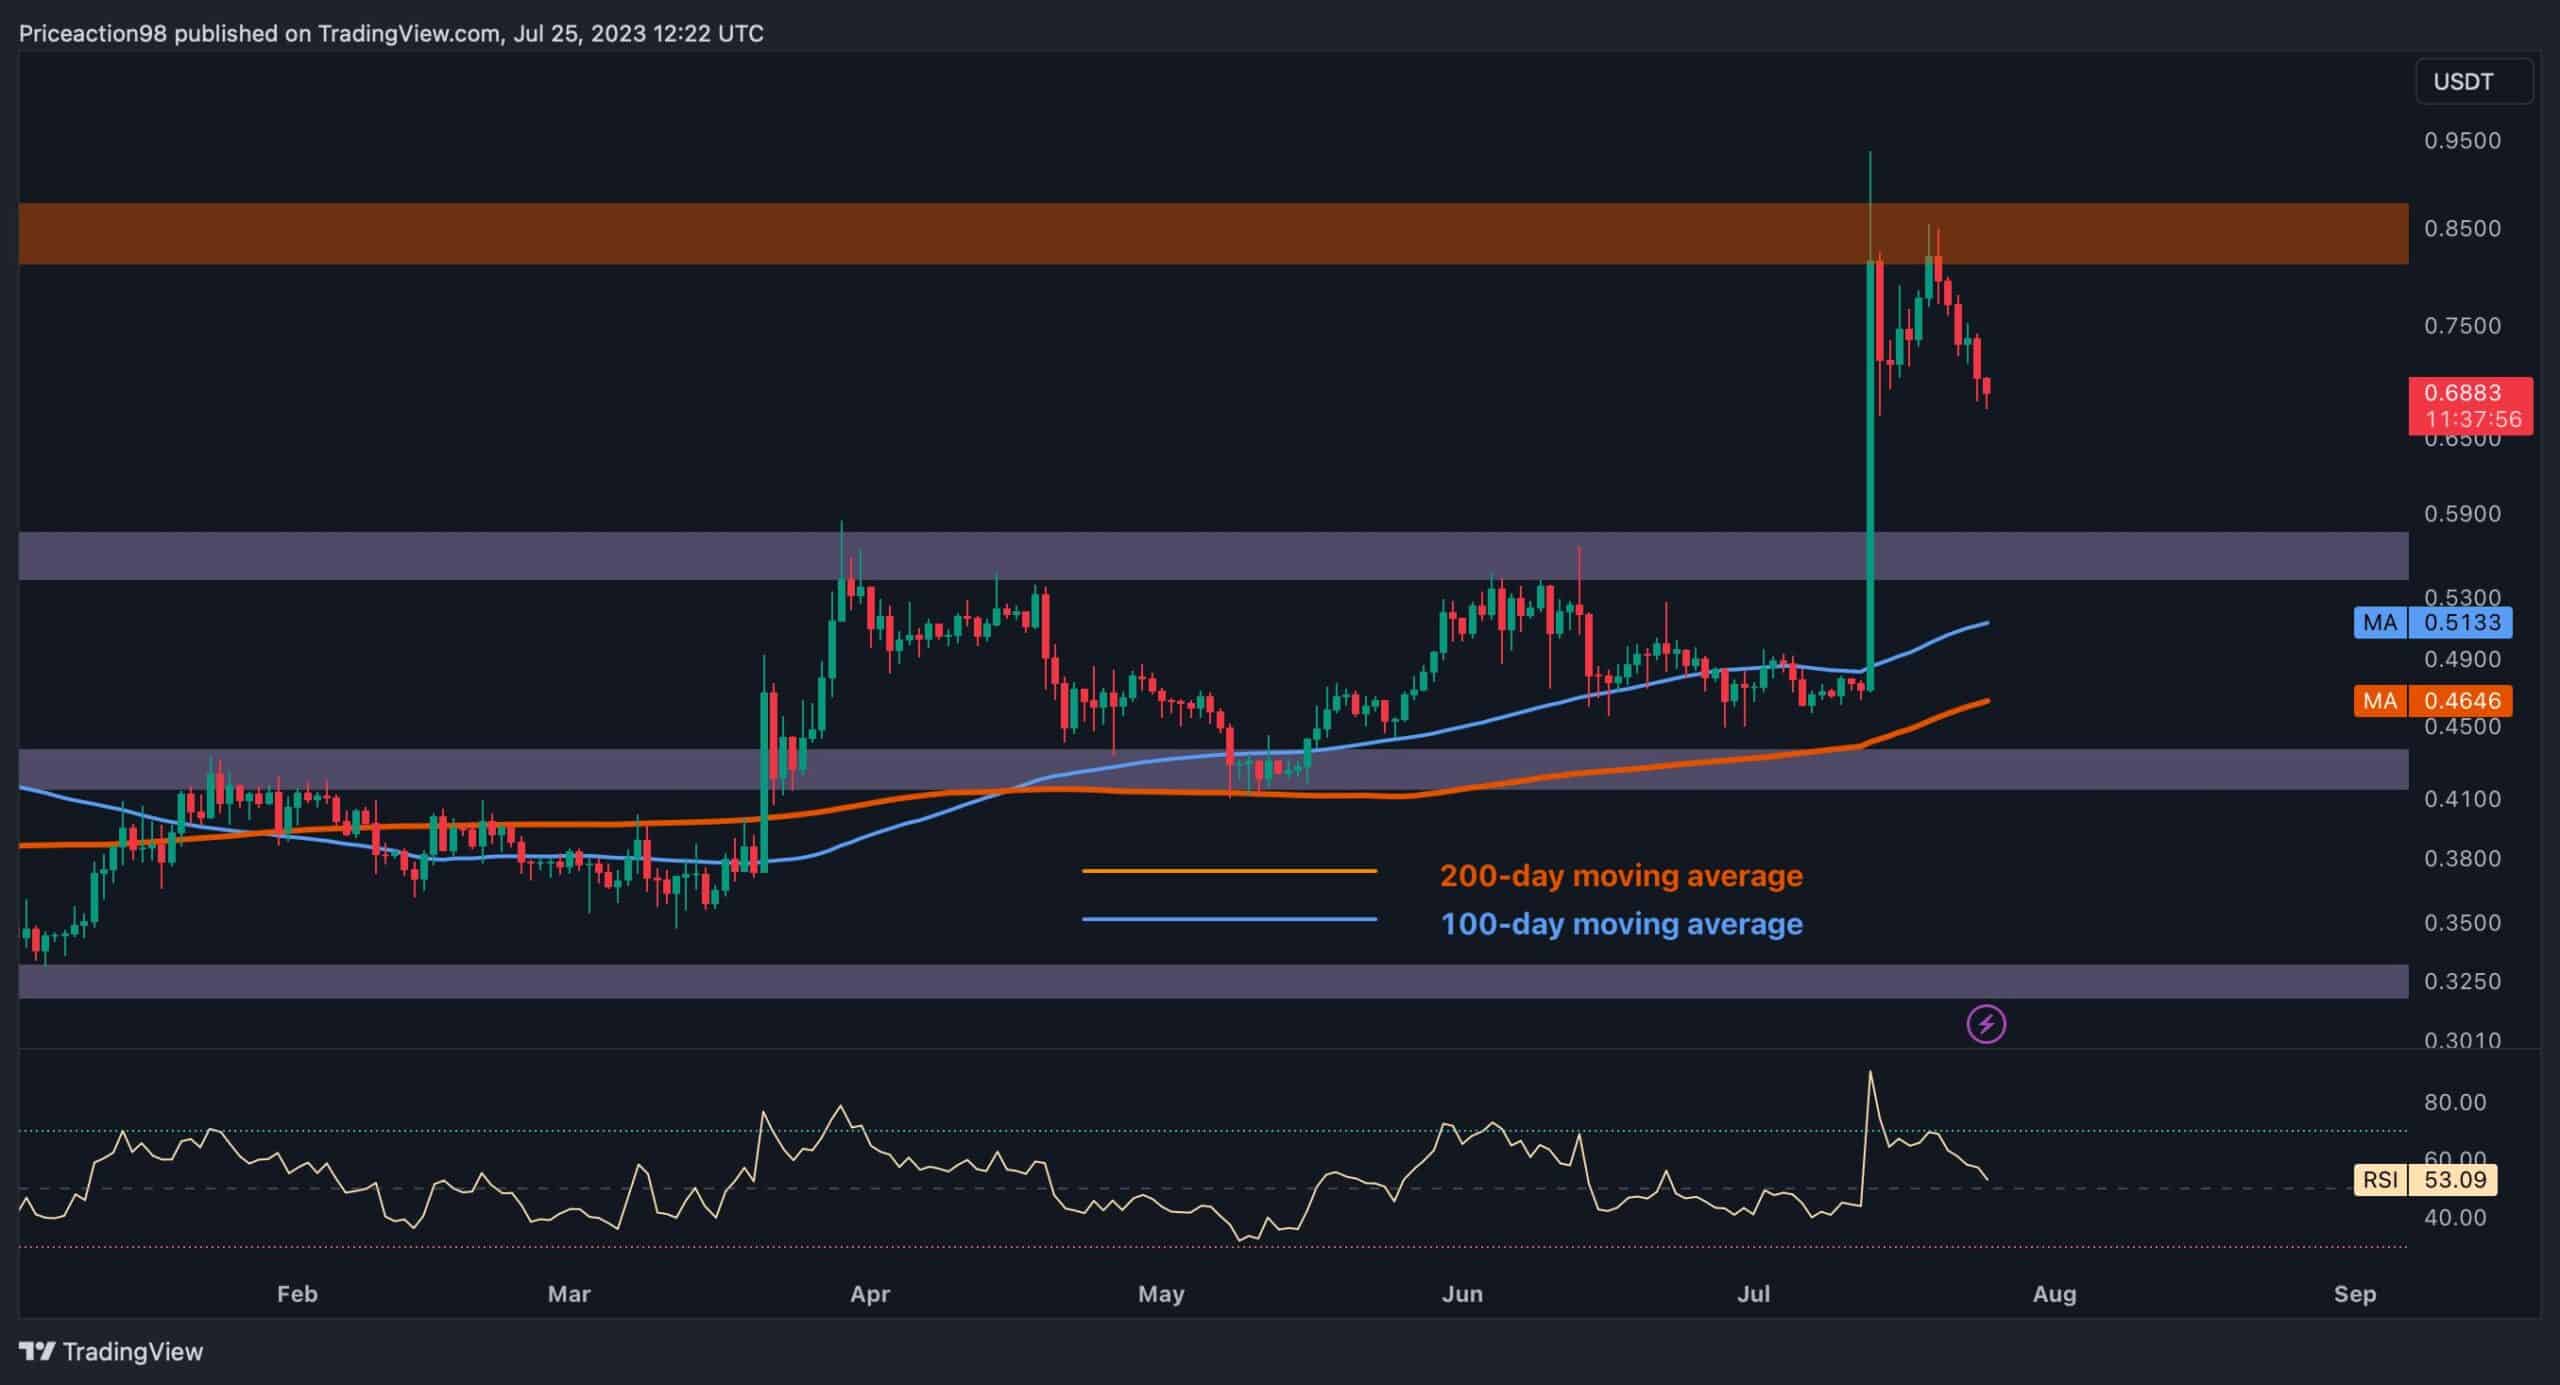
The Daily Chart
Analyzing the daily chart reveals that Ripple faced significant rejection upon reaching the crucial resistance zone at $0.85. This indicates robust selling pressure and substantial supply around this price range.
However, it’s important to recognize that a consolidation correction stage is necessary after impulsive price surges to validate the trend’s strength and allow the market to rest.
As a result, it seems likely that the price has entered a mid-term correction phase leading to higher volatility and pullback periods before the next significant movement occurs.
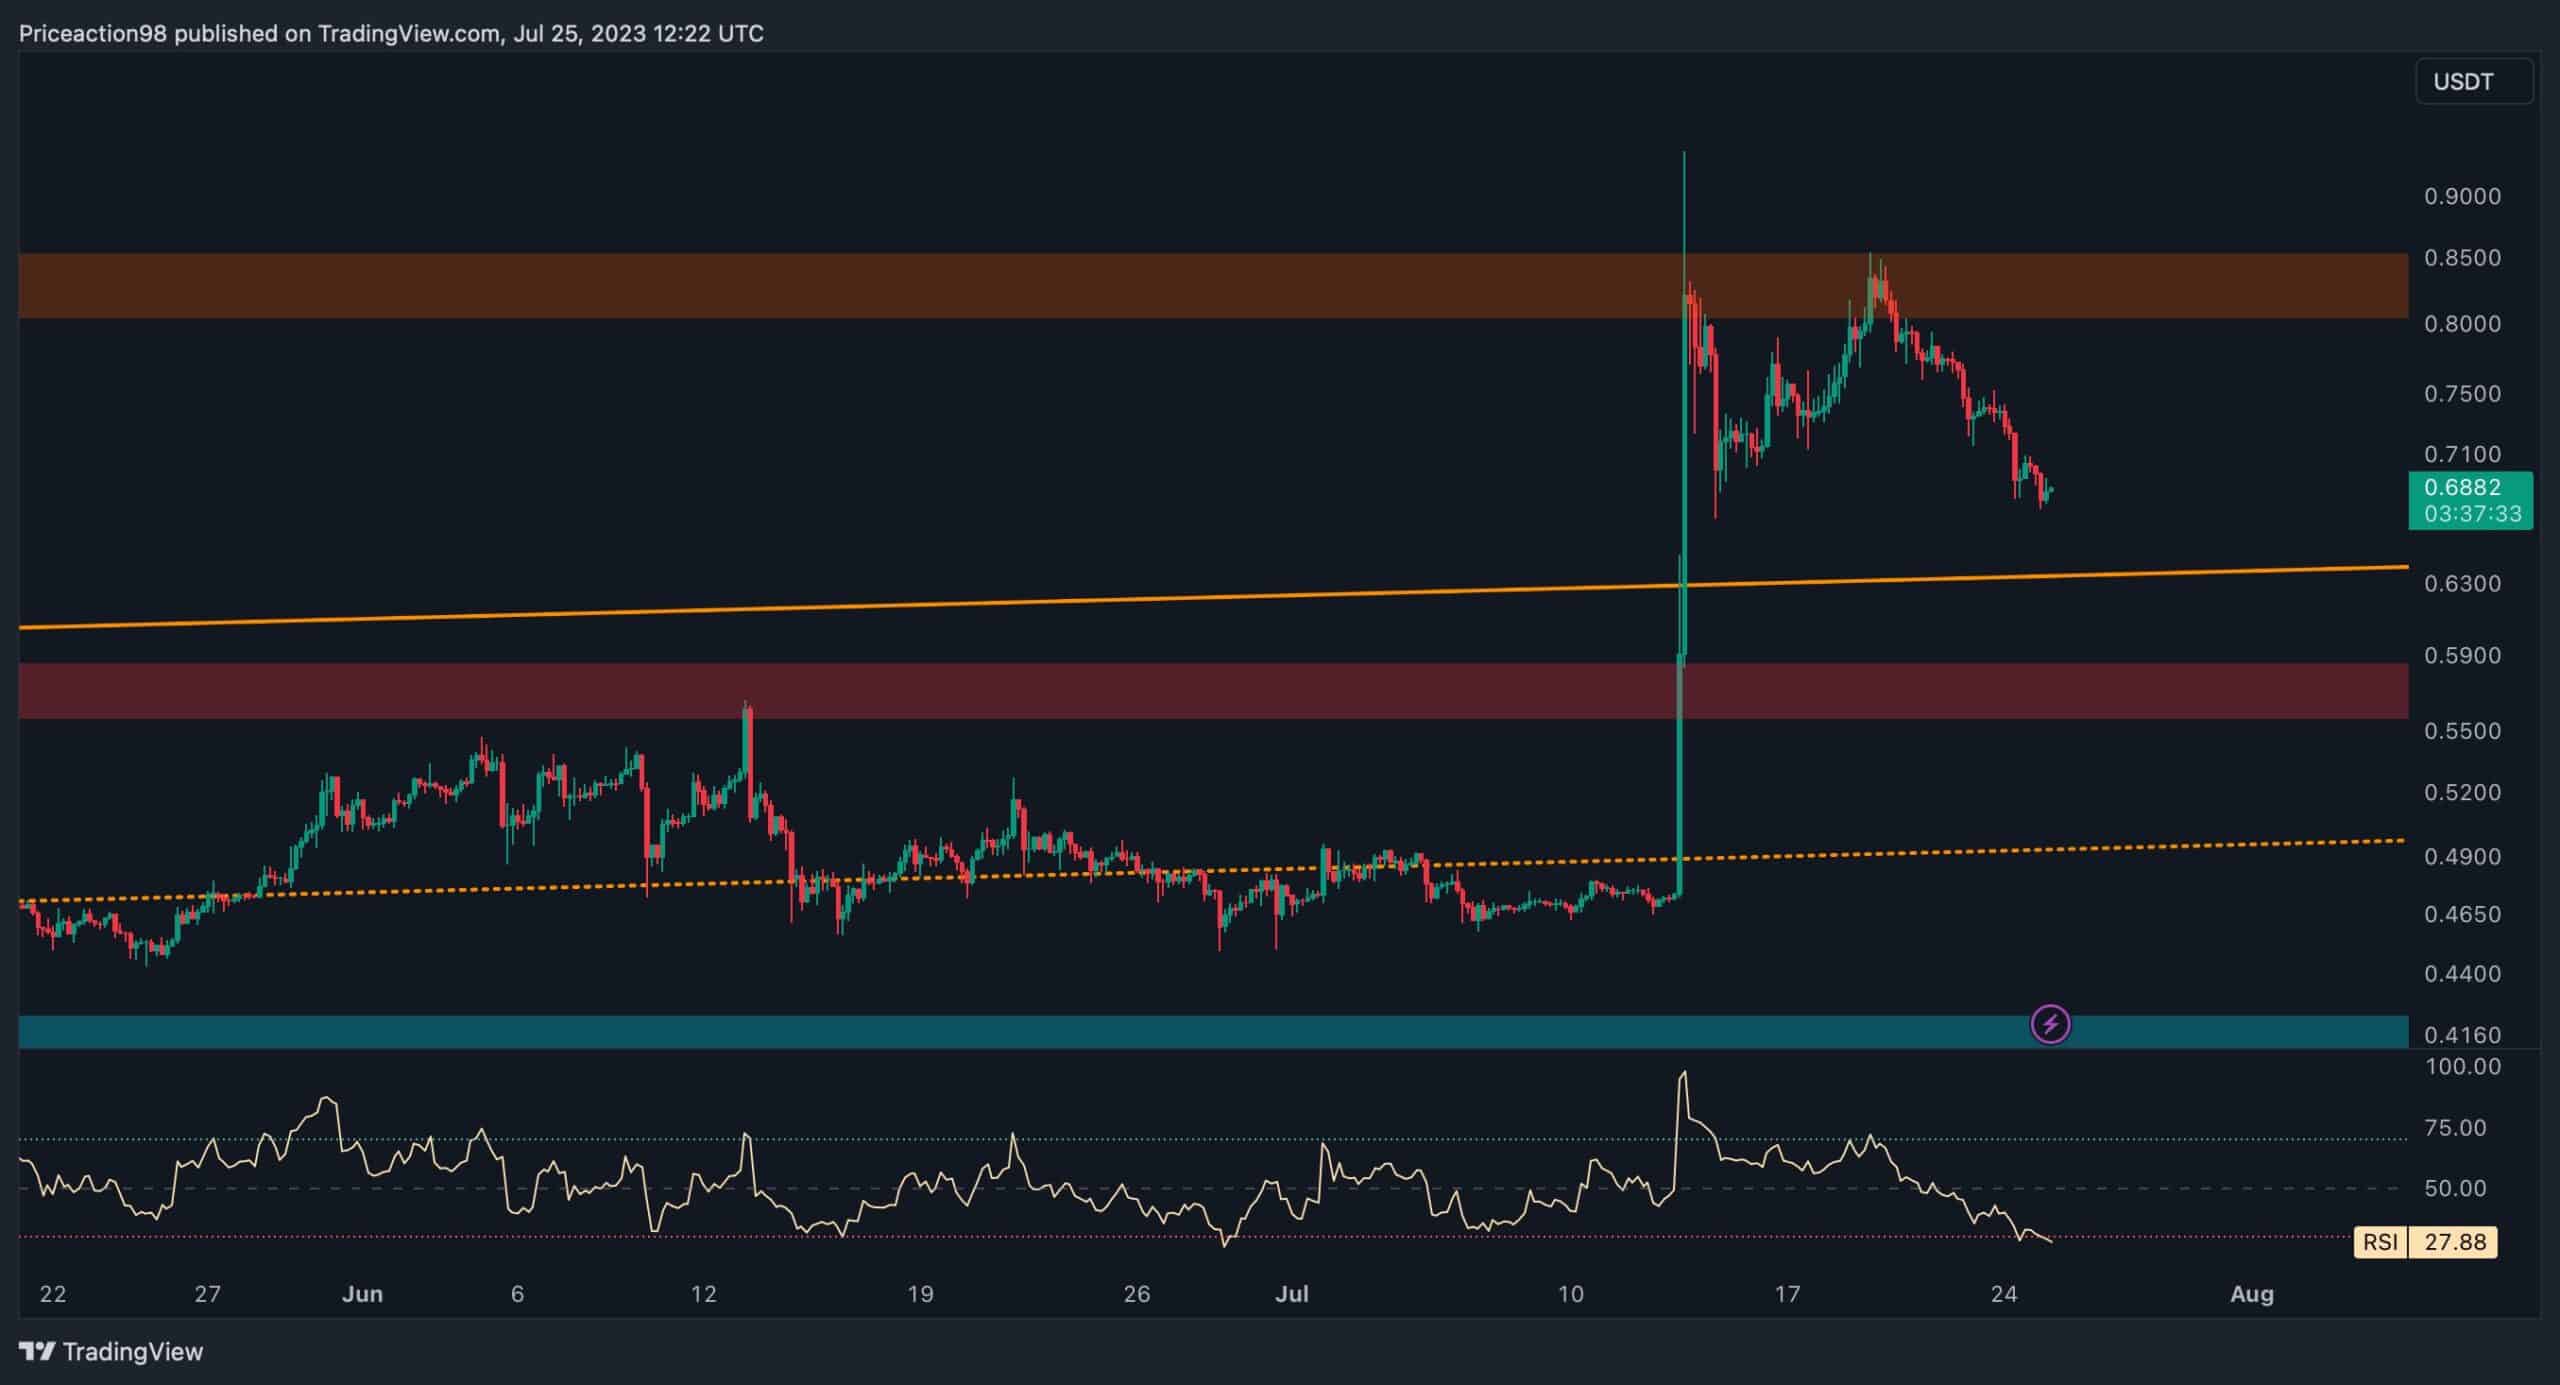
The 4-Hour Chart
In the 4-hour chart, it can be seen that the price successfully broke above the upper edge of a channel. However, after reaching the $0.85 region, it experienced a decline with consecutive red candles.
This suggests that a correction period is likely, retracing back to the upper boundary and completing a pullback. If this correction is successful, the market can expect to continue the bullish rally, propelling the price to higher levels.
The post XRP Crashes 7% as Market Turns Red, What’s Next? (Ripple Price Analysis) appeared first on CryptoPotato.