Bitcoin Price Analysis: BTC Unable to Push Above $43.5K as Bears Eye $40K Next
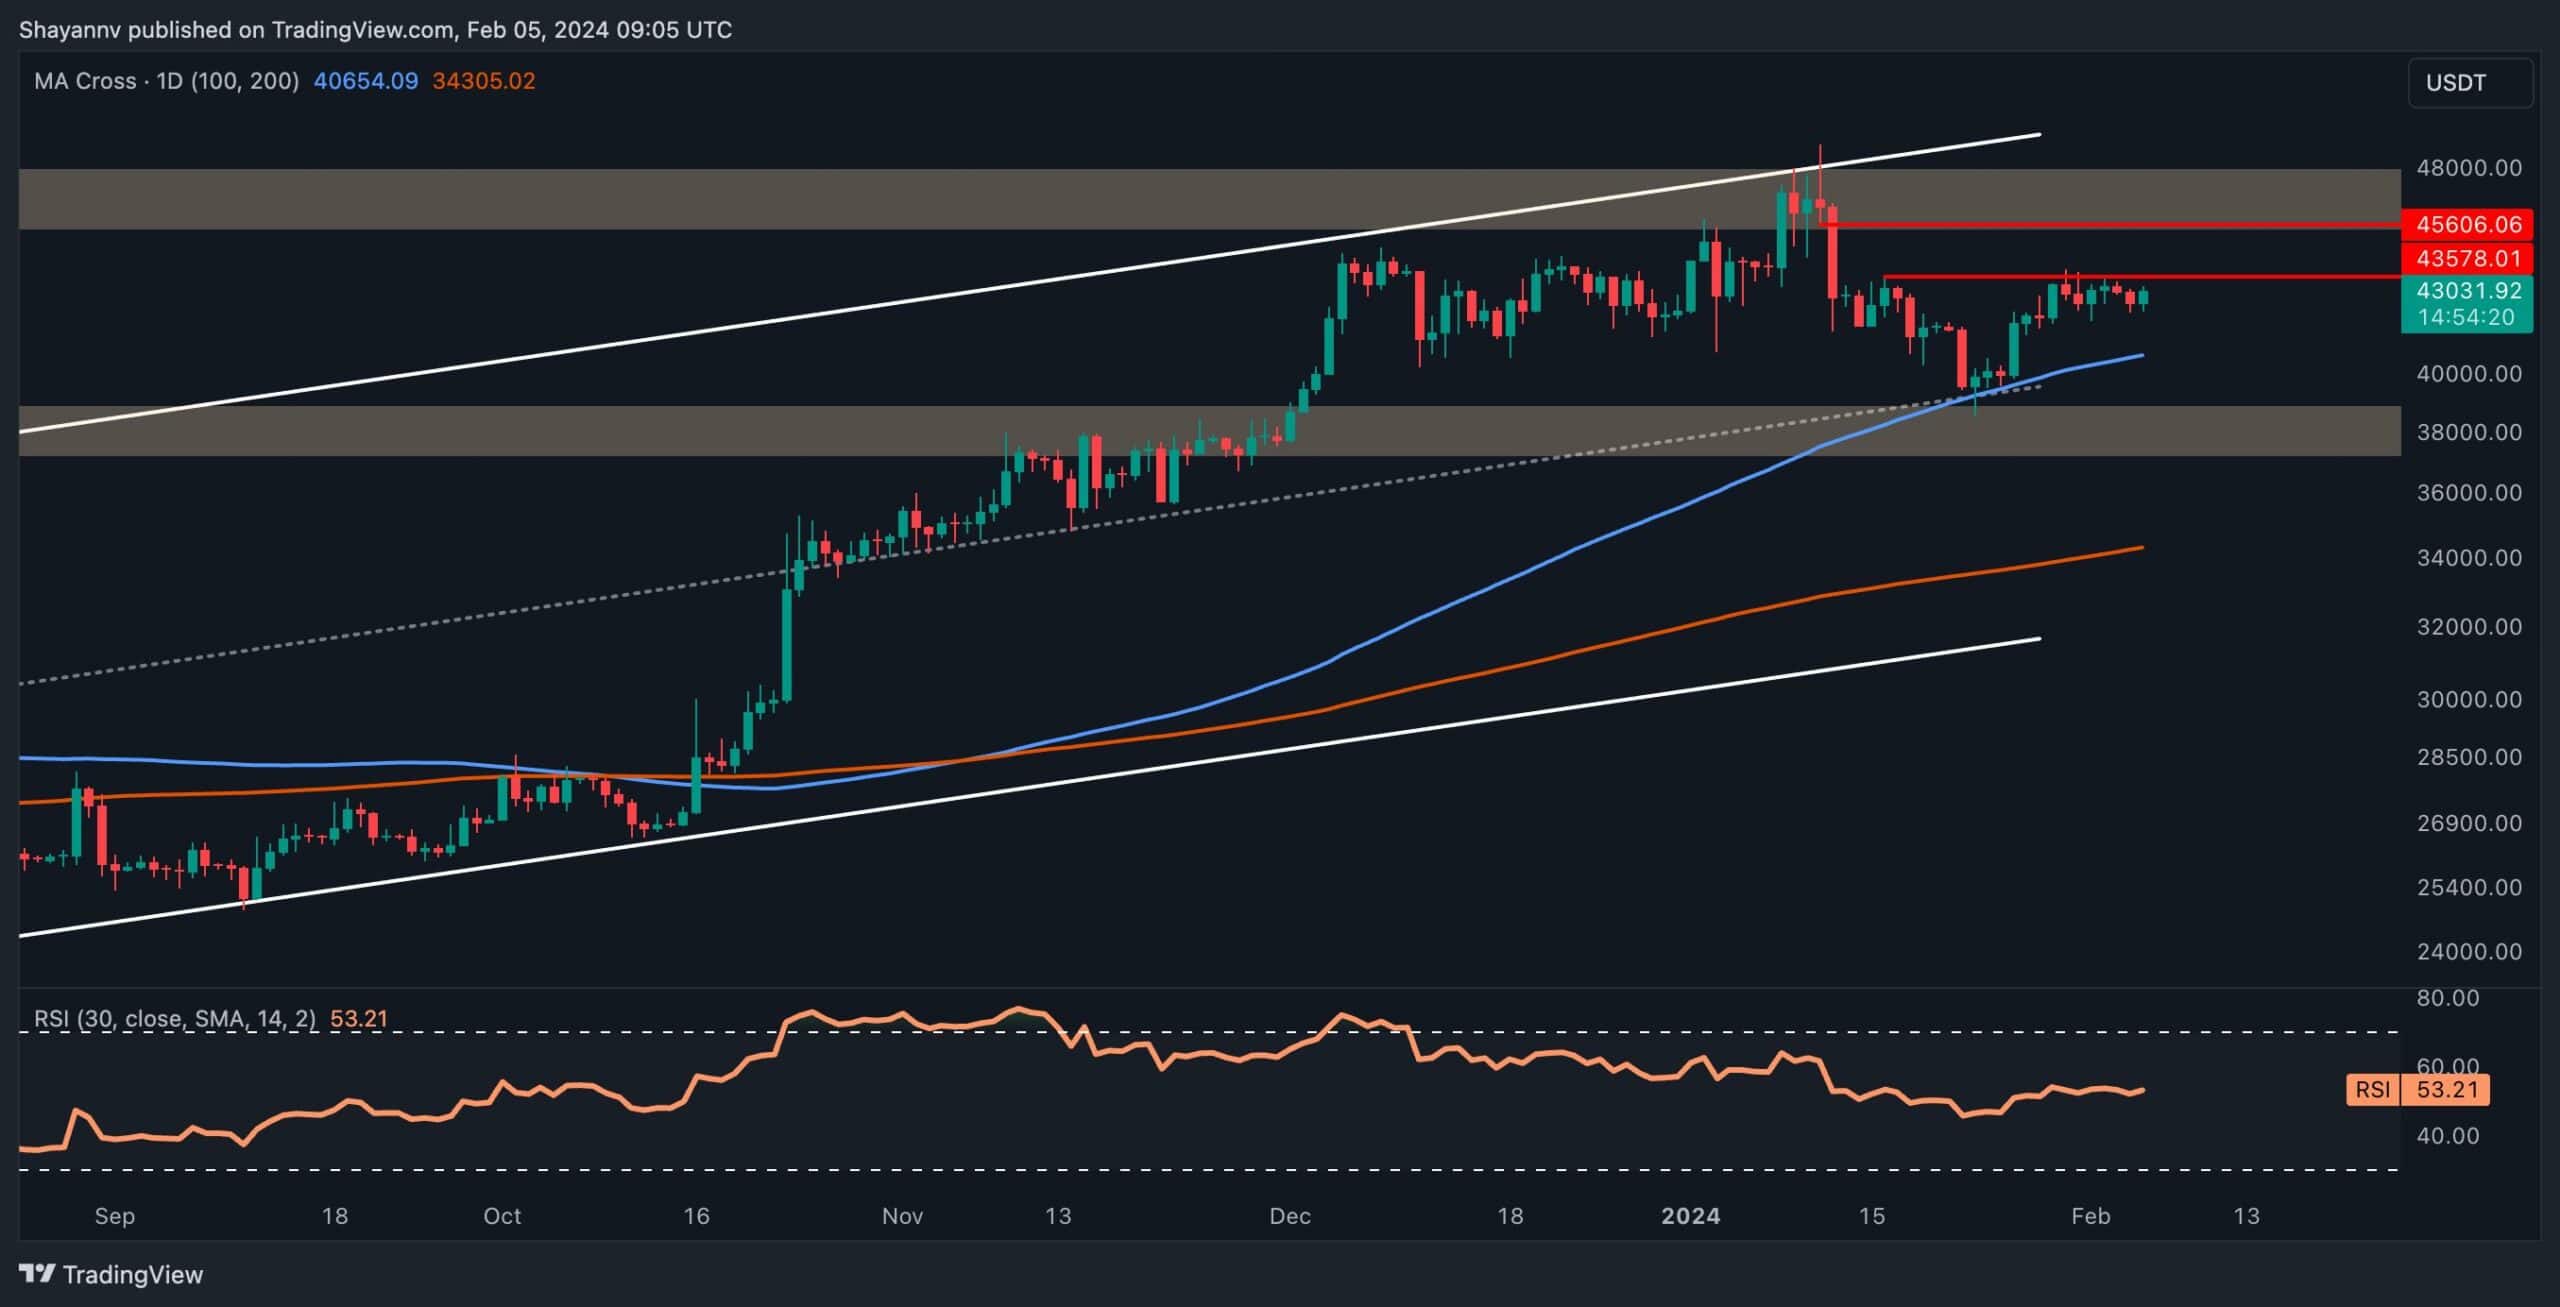
After rebounding from the substantial support region around the 100-day moving average, the price initiated a retracement towards the resistance range of $43,578-$45,606.
However, the momentum has weakened, suggesting the potential for a new bearish leg.
Technical Analysis
By Shayan
The Daily Chart
A thorough examination of the daily chart reveals that following Bitcoin’s recent bounce from a crucial support region, which includes the 100-day moving average aligned with the $40K level, the price embarked on a bullish retracement with the aim of reclaiming the yearly high at $48K.
Upon reaching a pivotal resistance region, defined by the existing fair value gap (FVG) within the $43,578 and $45,606 thresholds, Bitcoin’s bullish momentum faltered.
This led to a phase of slight consolidation with minimal volatility. This particular price range has the potential to act as a barrier against further buying pressure, potentially prompting a reversal towards the substantial 100-day moving average. However, a successful breach above this critical range could set the stage for another attempt to overcome the significant $48K resistance.
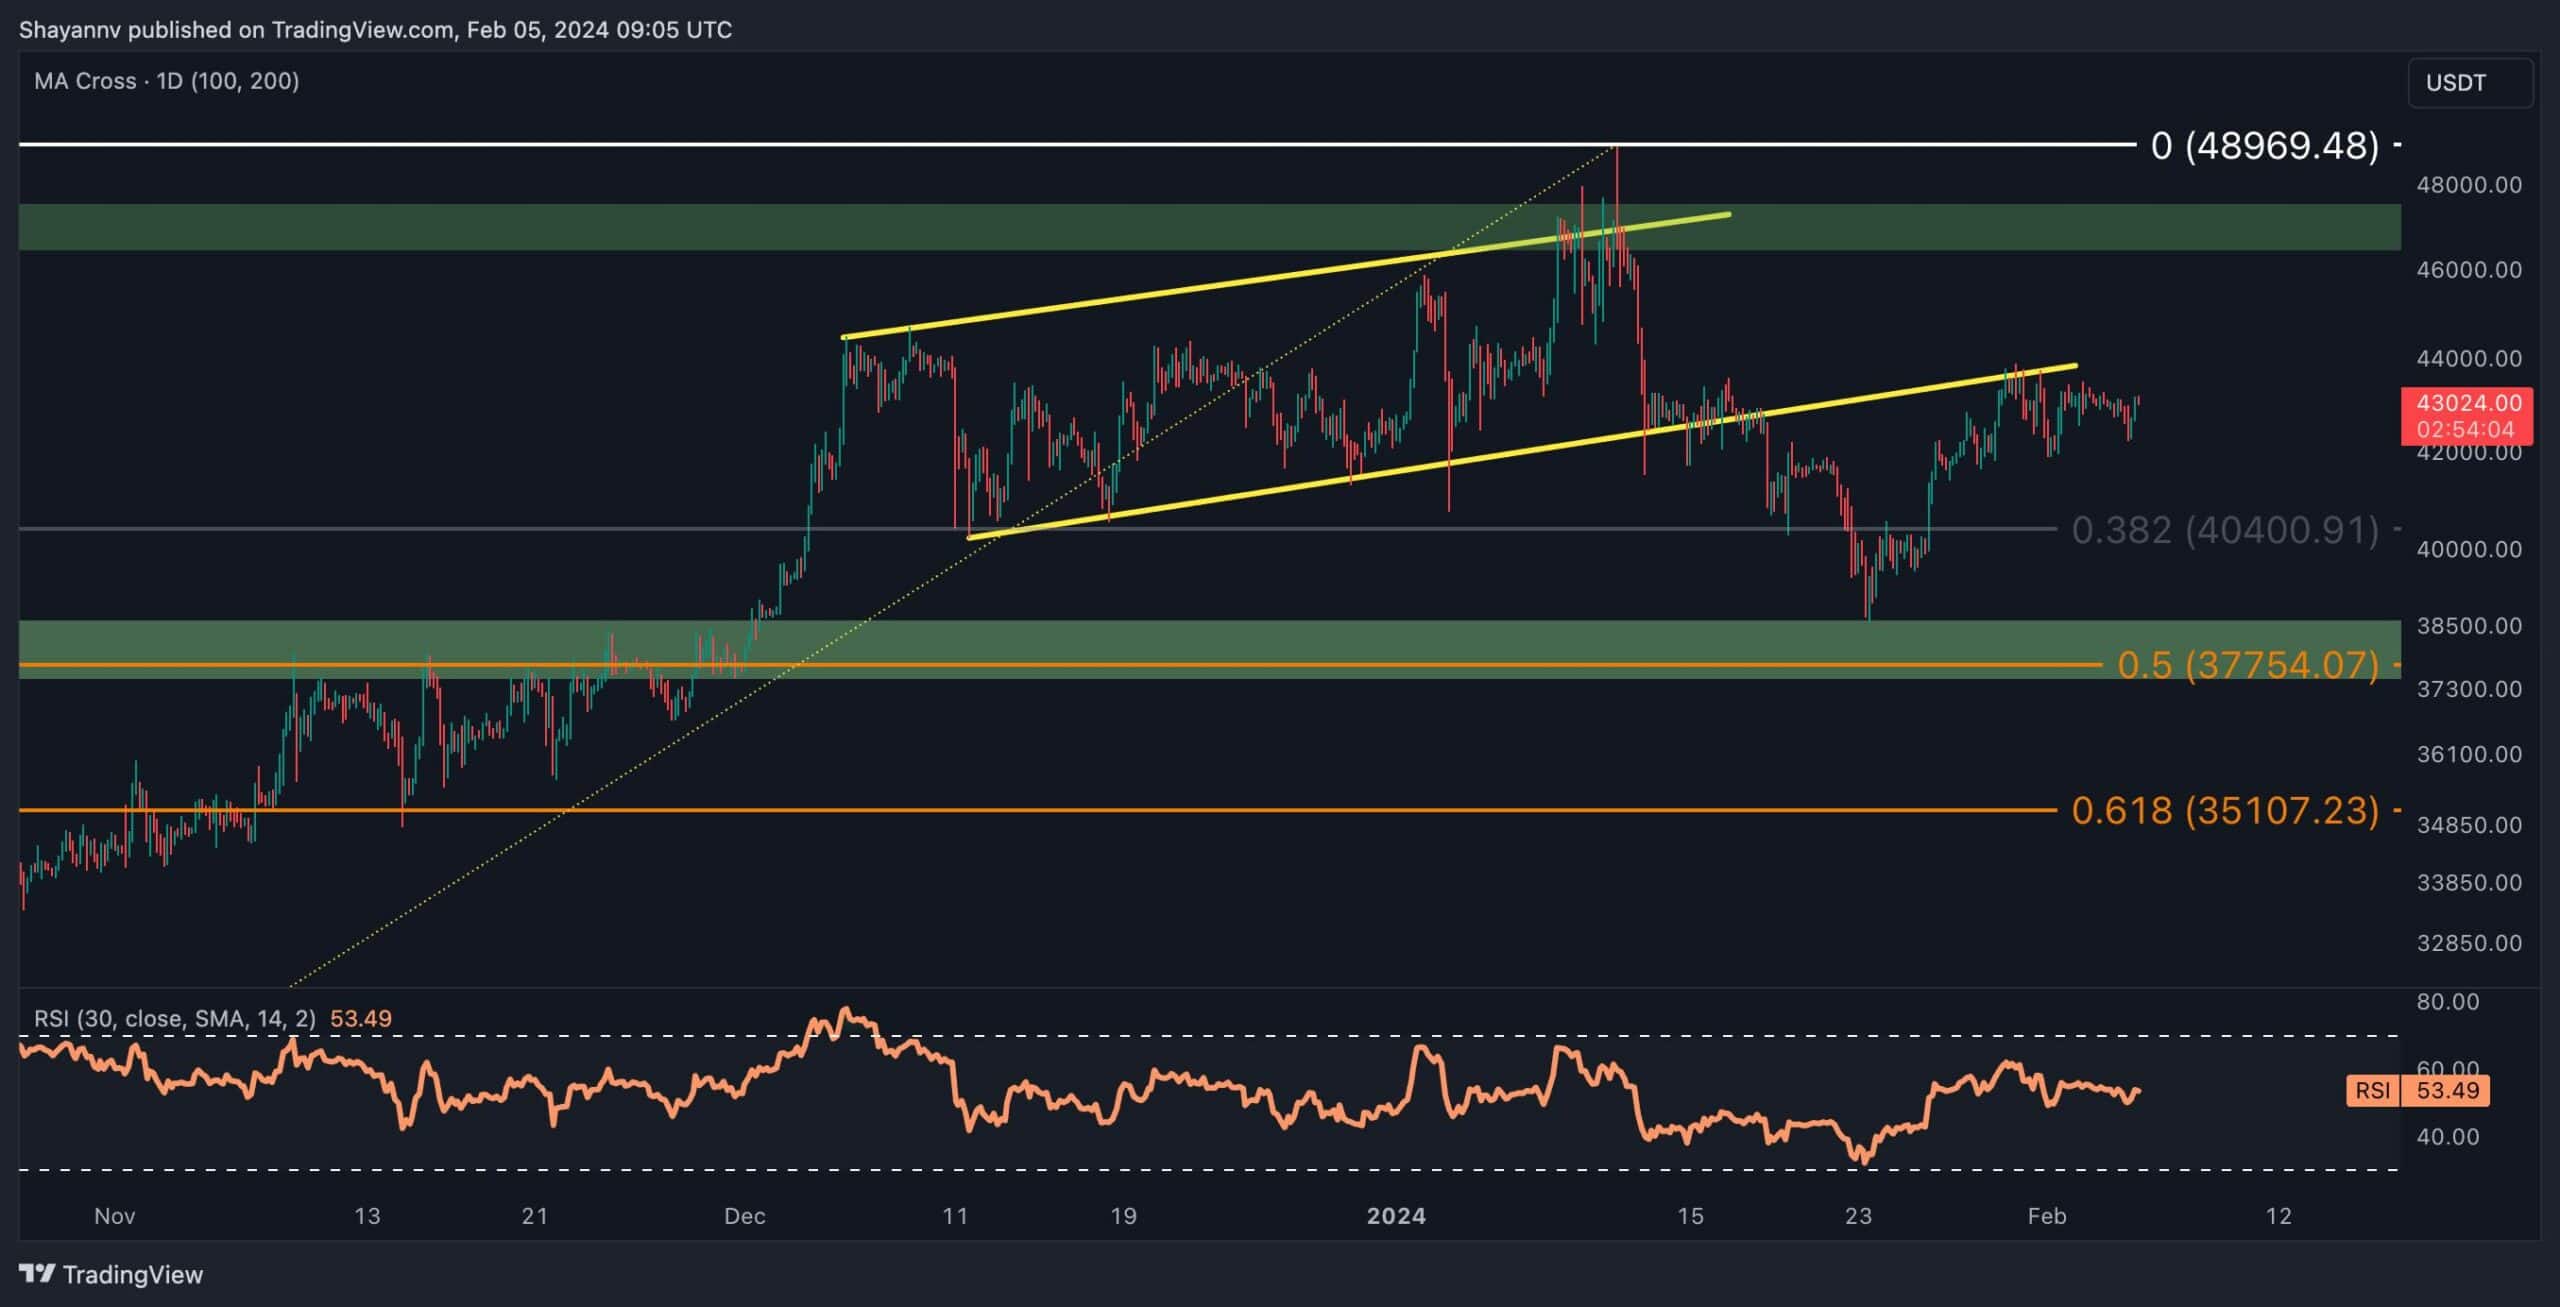
The 4-Hour Chart
An analysis of the 4-hour chart illustrates the extension of the bearish movement towards the static support zone, encompassing $39K and the significant 0.5 level of Fibonacci retracement.
However, prevailing buying pressure ultimately facilitated a bullish reversal, propelling the price towards a crucial resistance marked by the lower boundary of the ascending flag.
Despite this bullish reversal, recent price action and low volatility indicate a heightened potential for a renewed bearish move in the coming days. Therefore, in the event of a successful pullback, the market should brace for a mid-term descent towards the $38K significant support region. It’s essential for traders to manage risk by considering an alternative scenario where an unexpected surge above the flag’s lower boundary occurs, leading to a renewed bullish movement.
On-chain Analysis
By Shayan
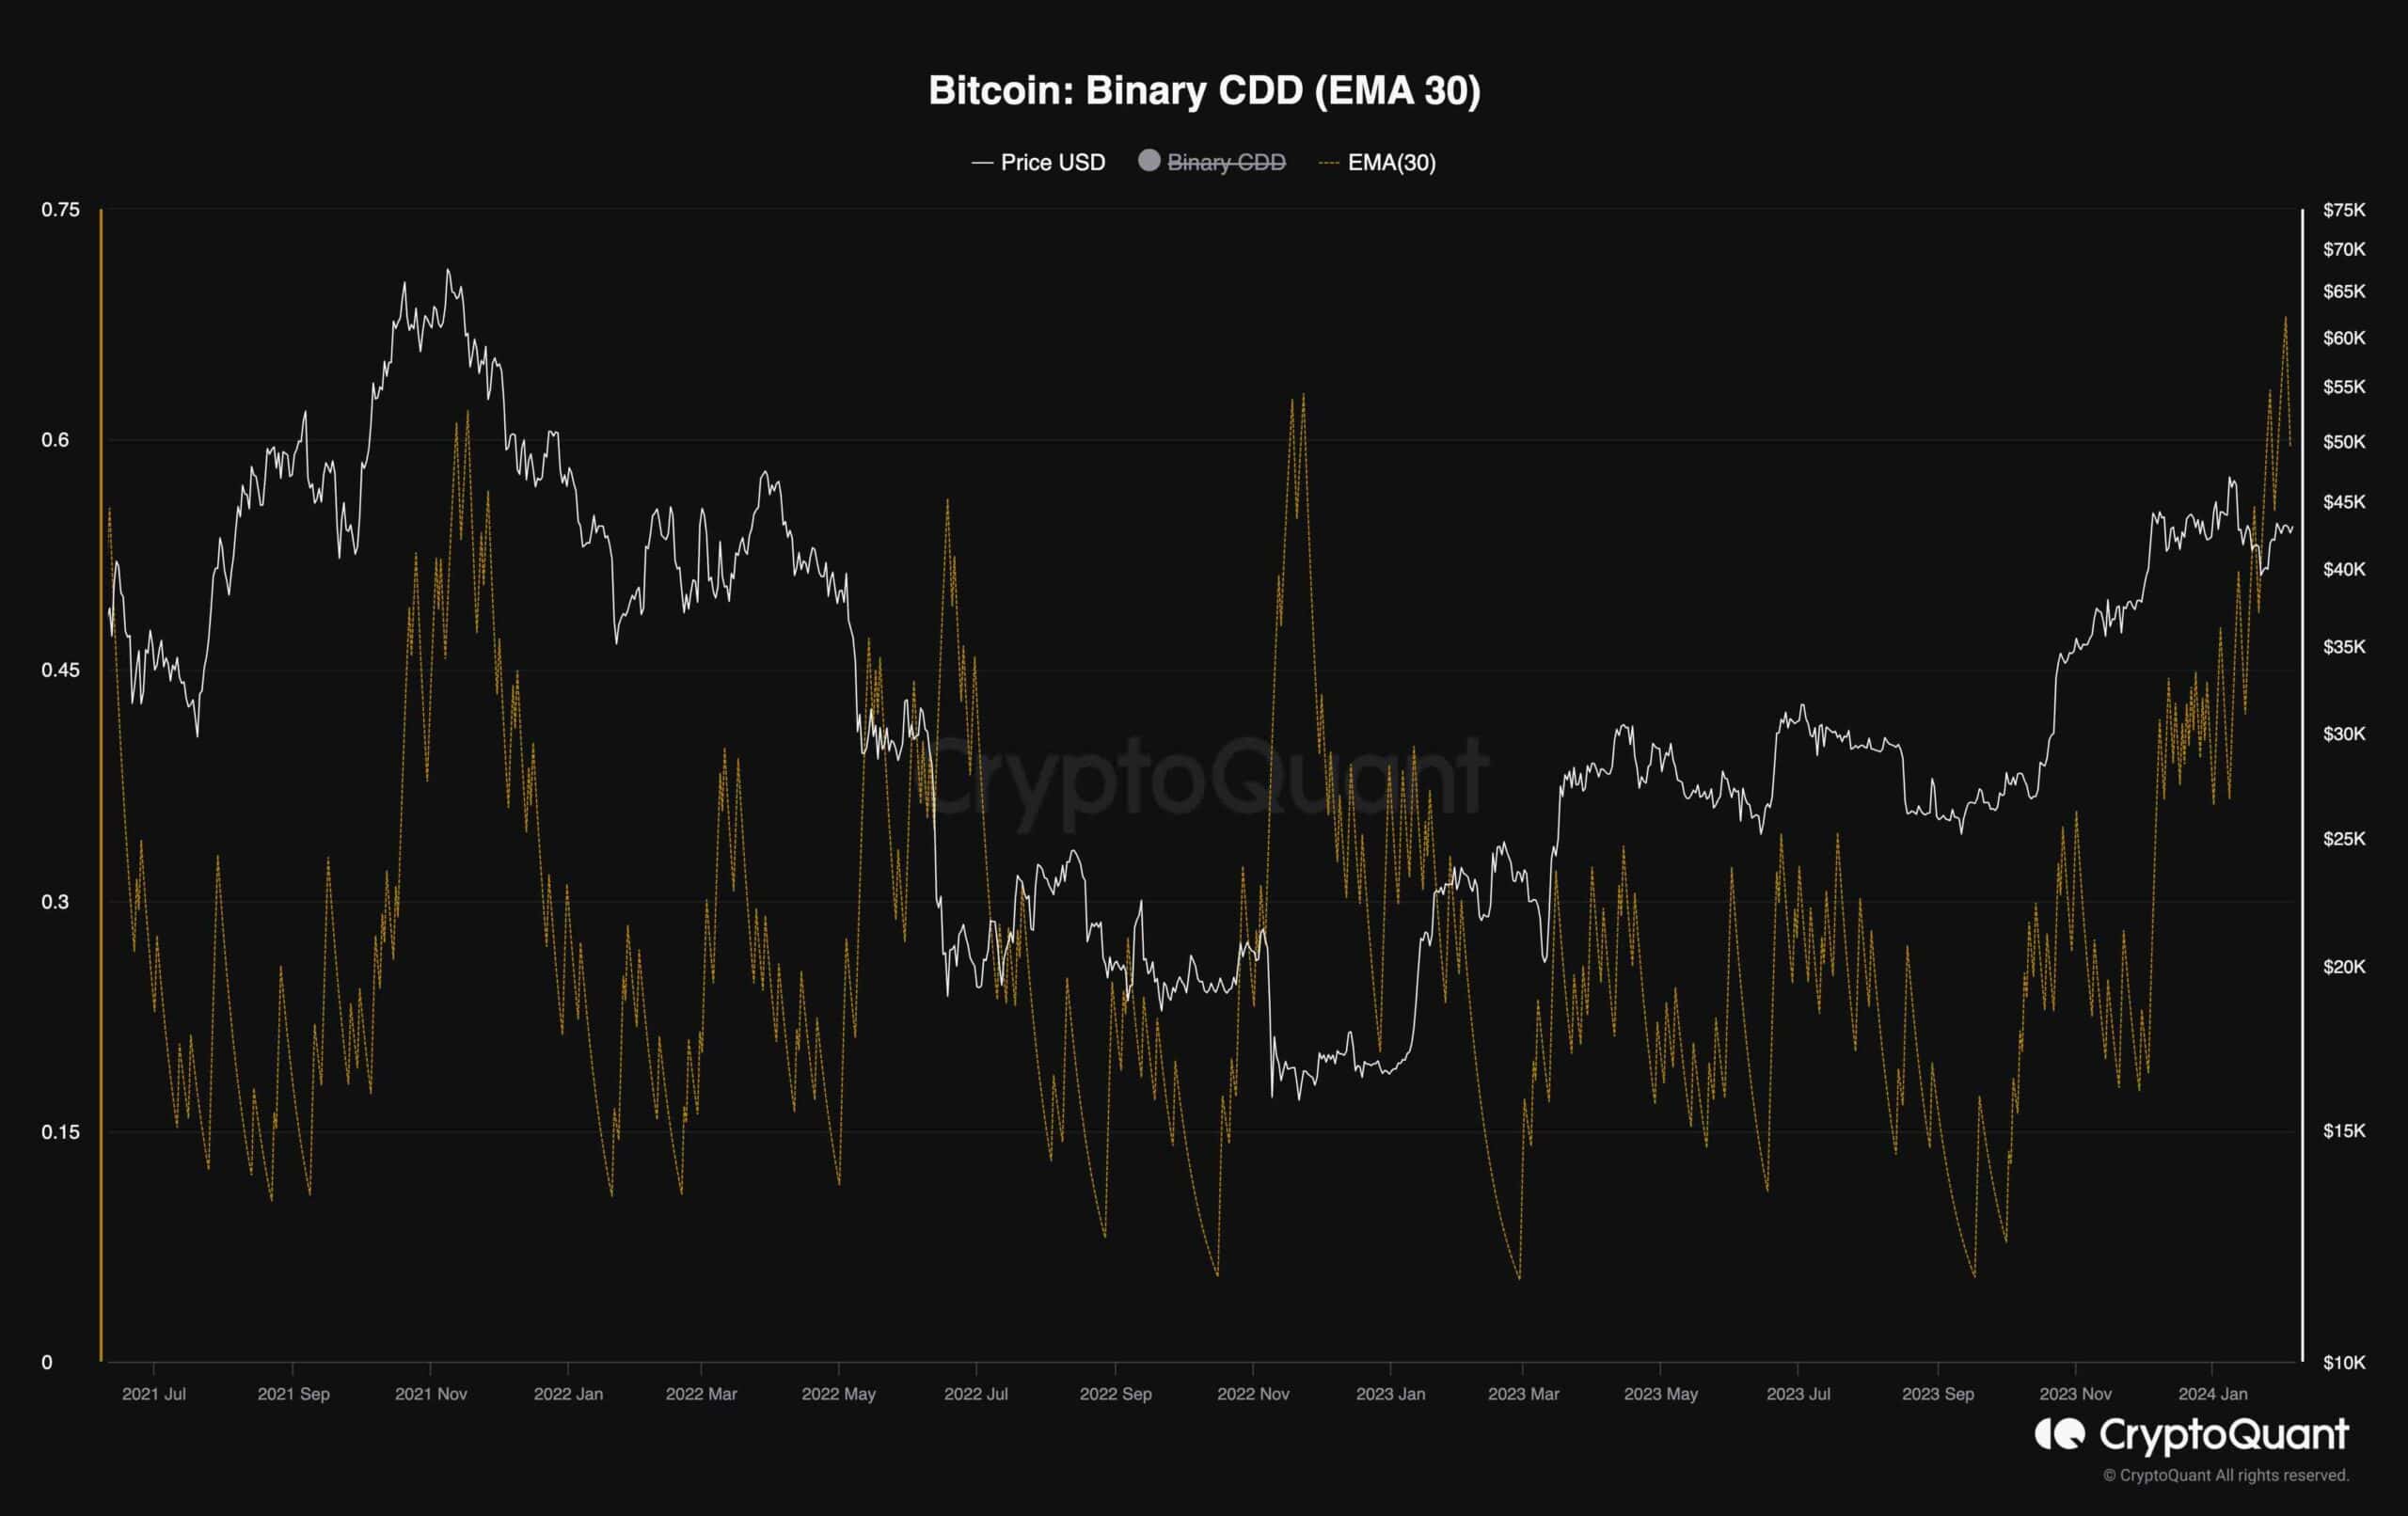
The current market landscape suggests a quest for trends, yet significant players have displayed a notable sense of stillness in recent weeks. Examining their behavior becomes crucial in discerning prevailing trends, a task facilitated by the Binary Coin Days Destroyed (CDD) metric chart featuring a 30-day moving average.
Binary CDD operates as a binary value, denoted as ‘1’ when the Supply Adjusted Coin Days Destroyed exceeds the average and ‘0’ otherwise. This metric serves as an indicator of whether the actions of long-term holders surpass or lag behind the average.
As depicted in the chart, Binary CDD has undergone a significant uptrend, coinciding with a notable surge in Bitcoin’s price, indicative of heightened activity among smart money. Long-term holders may perceive this uptrend as an opportune moment to distribute their assets and adjust their exposure to the market.
Consequently, the market may be on the brink of a short-term correction stage, retracing back towards the $38K region. Continued monitoring of this metric will be instrumental in gauging potential shifts in market dynamics.
The post Bitcoin Price Analysis: BTC Unable to Push Above $43.5K as Bears Eye $40K Next appeared first on CryptoPotato.