XRP Bulls Attempt a Recovery But is the Pain Over or Will $0.5 Fall? (Ripple Price Analysis)
After breaking below the multi-month ascending trendline, XRP has exhibited uncertain price action, indicating a lack of market activity and momentum. However, the cryptocurrency has reached a critical resistance level, potentially signaling another downturn in the mid-term.
Ripple Price Analysis: Technicals
By Shayan
The Daily Chart
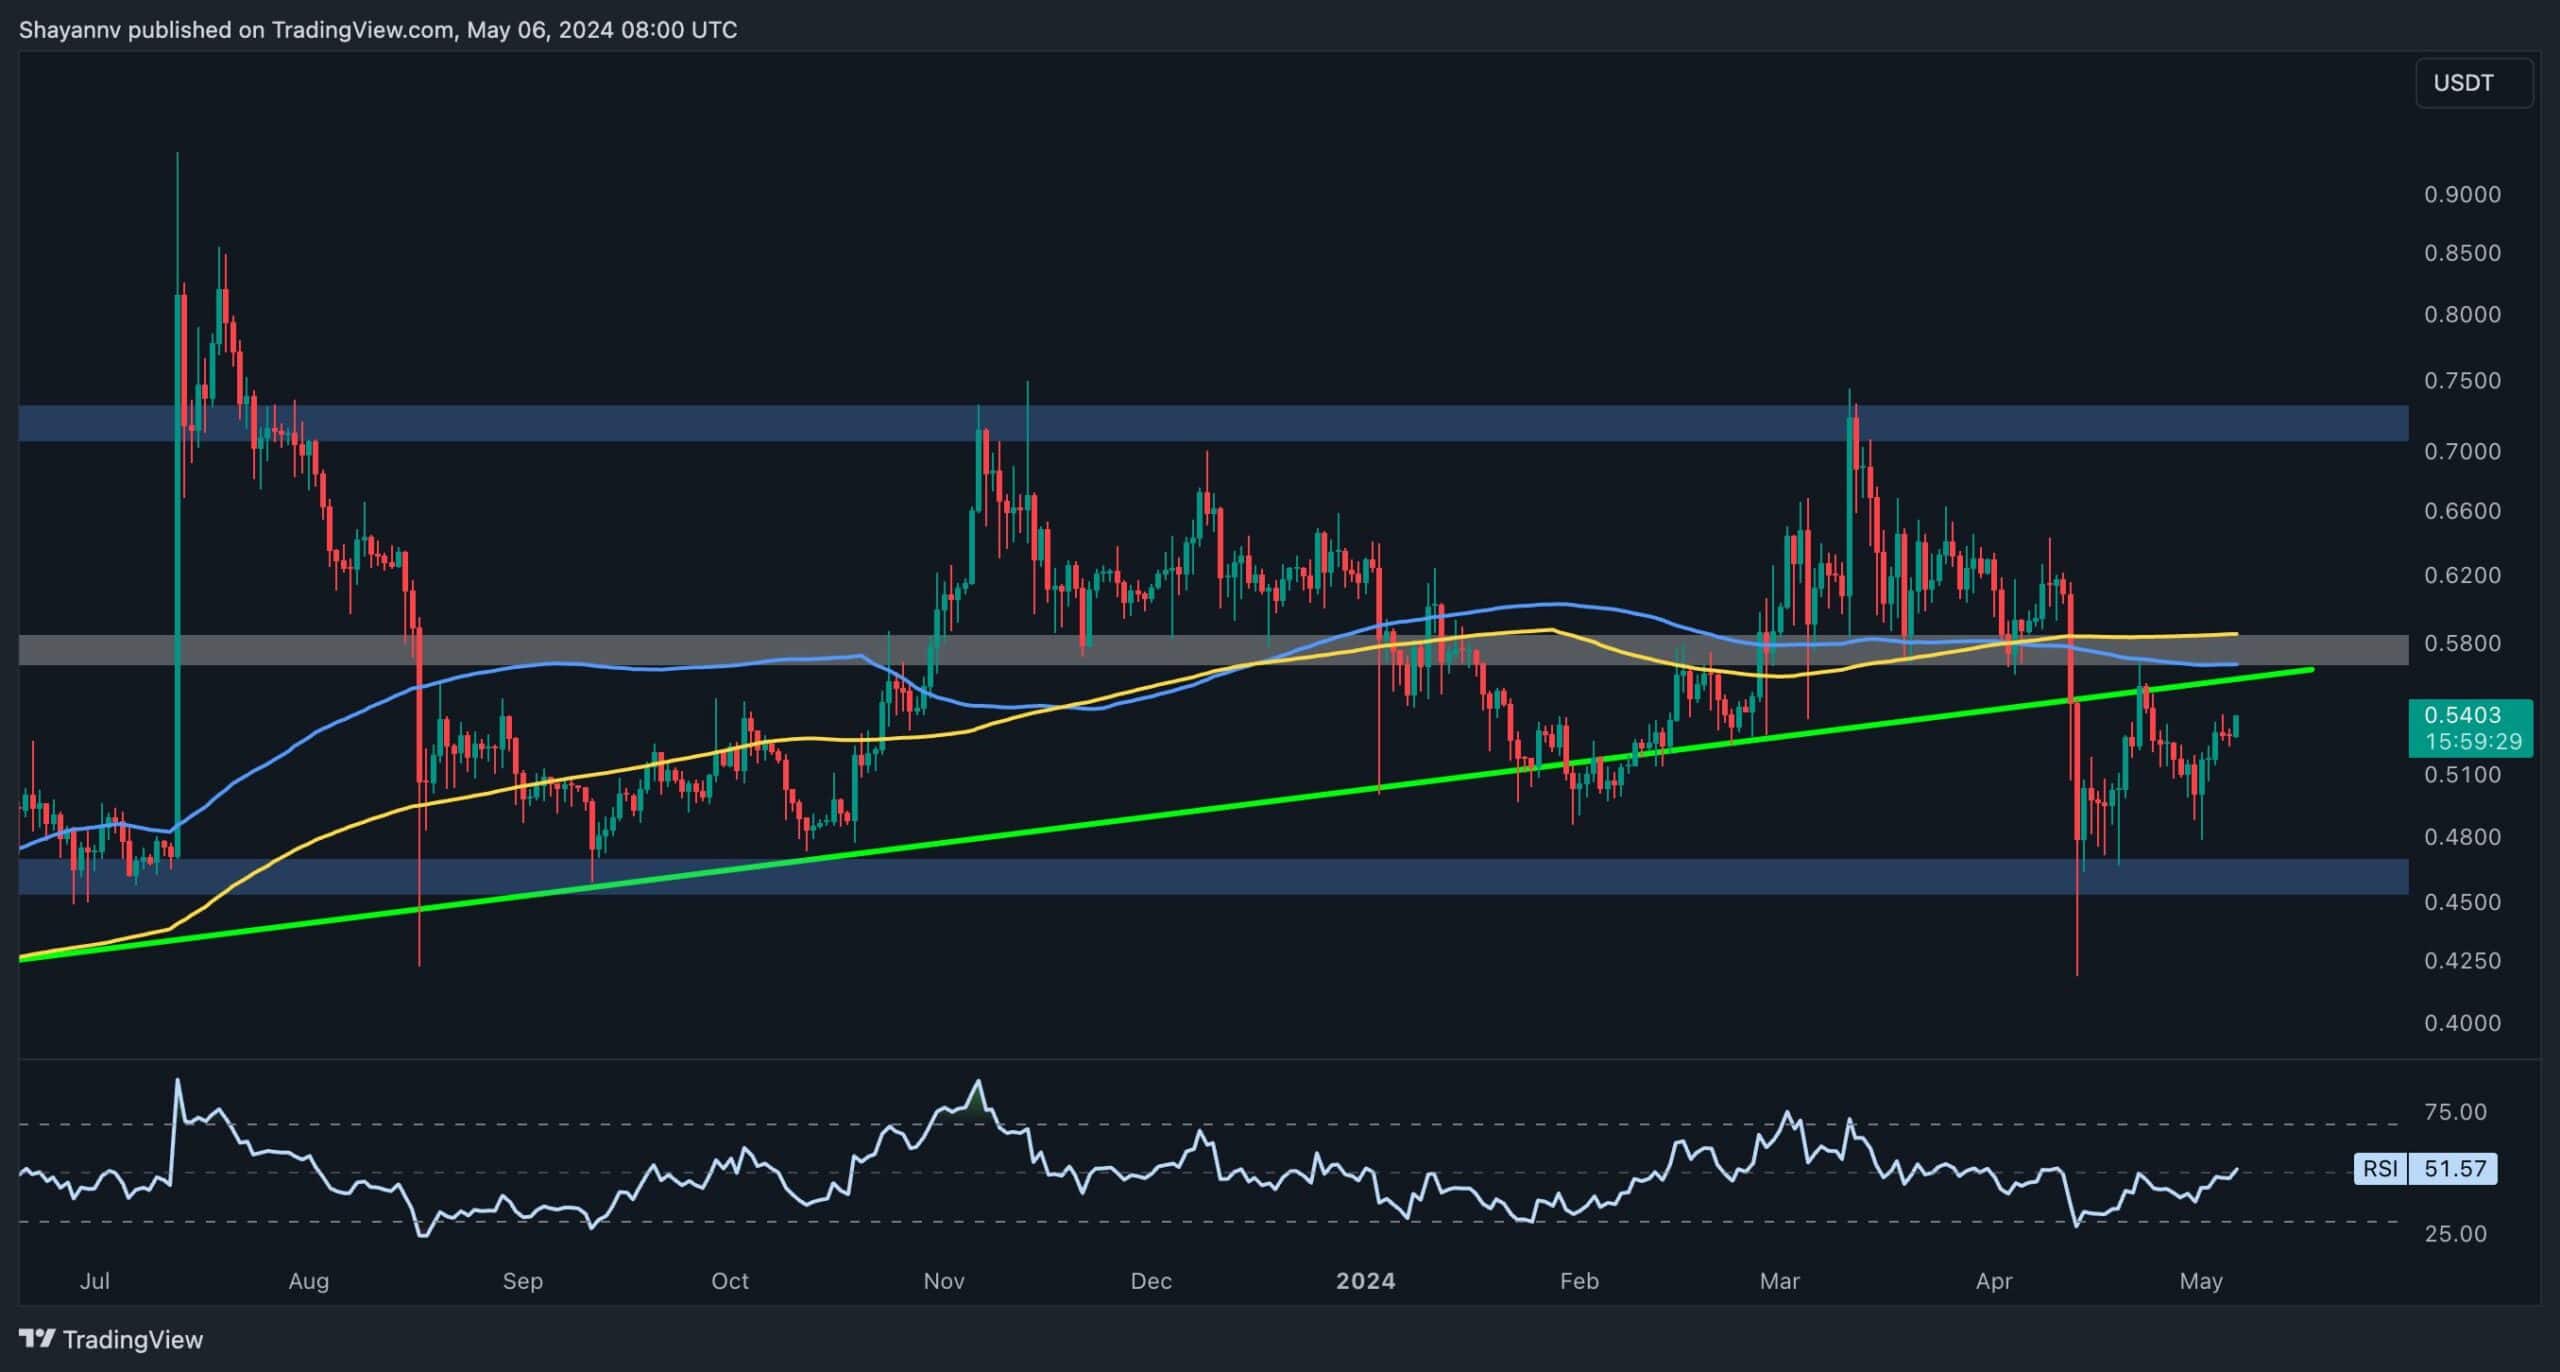
Upon thoroughly examining the daily chart, it becomes evident that XRP faced intensified selling pressure, resulting in a significant decline below the multi-month ascending trendline.
Nevertheless, buyers intervened at the $0.45 threshold, triggering a bullish rebound towards the previously breached ascending trendline at $0.56, potentially completing a pullback.
However, the recent price action suggests uncertainty and a lack of clear direction in the market. Ripple is potentially poised for sustained consolidation within the price range bounded by the critical support region of $0.45 and the pivotal resistance at $0.59.
Consequently, XRP seems likely to remain within this price range in the middle term until a breakout occurs.
The 4-Hour Chart
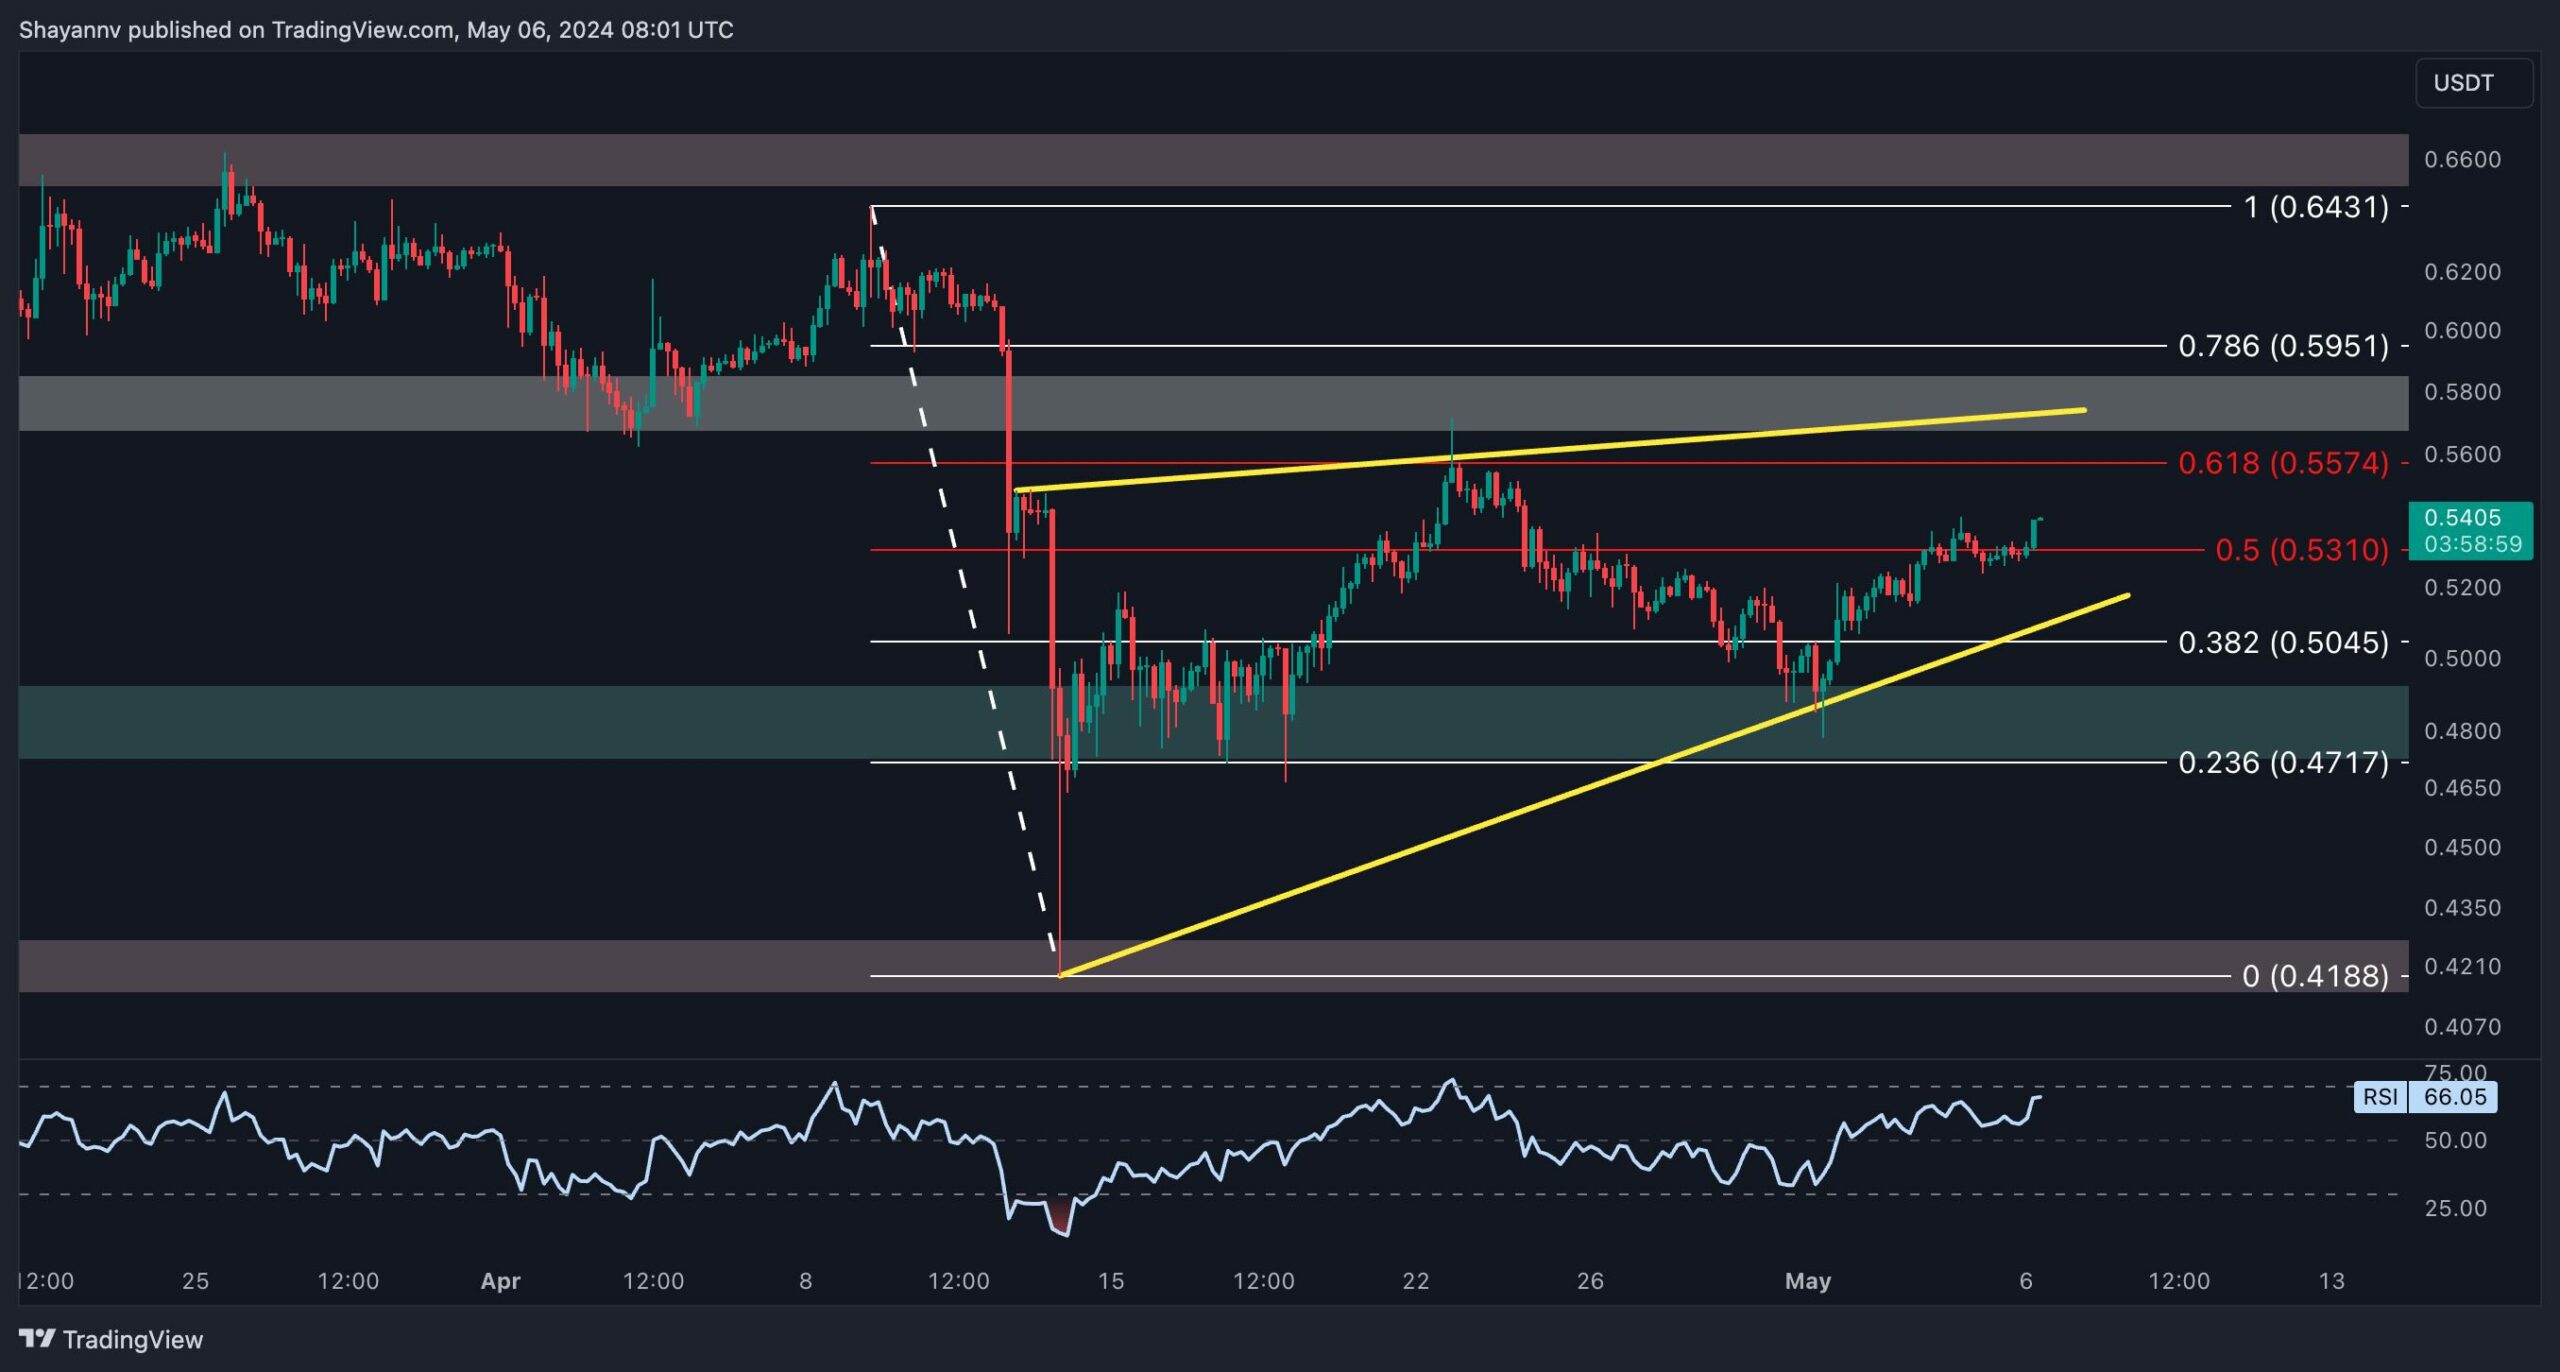
A closer examination of the 4-hour chart reveals that after finding support around the $0.49 mark, the price went through a bullish retracement towards a significant resistance region outlined by the price range between the 0.5 ($0.5310) and 0.618 ($0.5574) Fibonacci levels.
However, during the recent fluctuations, XRP formed an ascending wedge pattern, a well-known indication of a potential bearish retracement if breached from its lower boundary. Currently, the price faces significant selling pressure near the 0.5 ($0.5310) and 0.618 ($0.5574) Fibonacci levels, potentially suggesting renewed bearish movement.
Nevertheless, if the cryptocurrency breaks below the wedge’s lower boundary, a sustained bearish movement may ensue, targeting the $0.48 threshold in the short term.
The post XRP Bulls Attempt a Recovery But is the Pain Over or Will $0.5 Fall? (Ripple Price Analysis) appeared first on CryptoPotato.