XRP Bull Run Nowhere to Be Seen as Bears Eye $0.5 Next: Ripple Price Analysis
Ripple’s price has yet to show a sign of recovery and is continuing its overall bearish trend. If things are to change, the price should soon begin its recovery, as the market is in a critical area.
Technical Analysis
By TradingRage
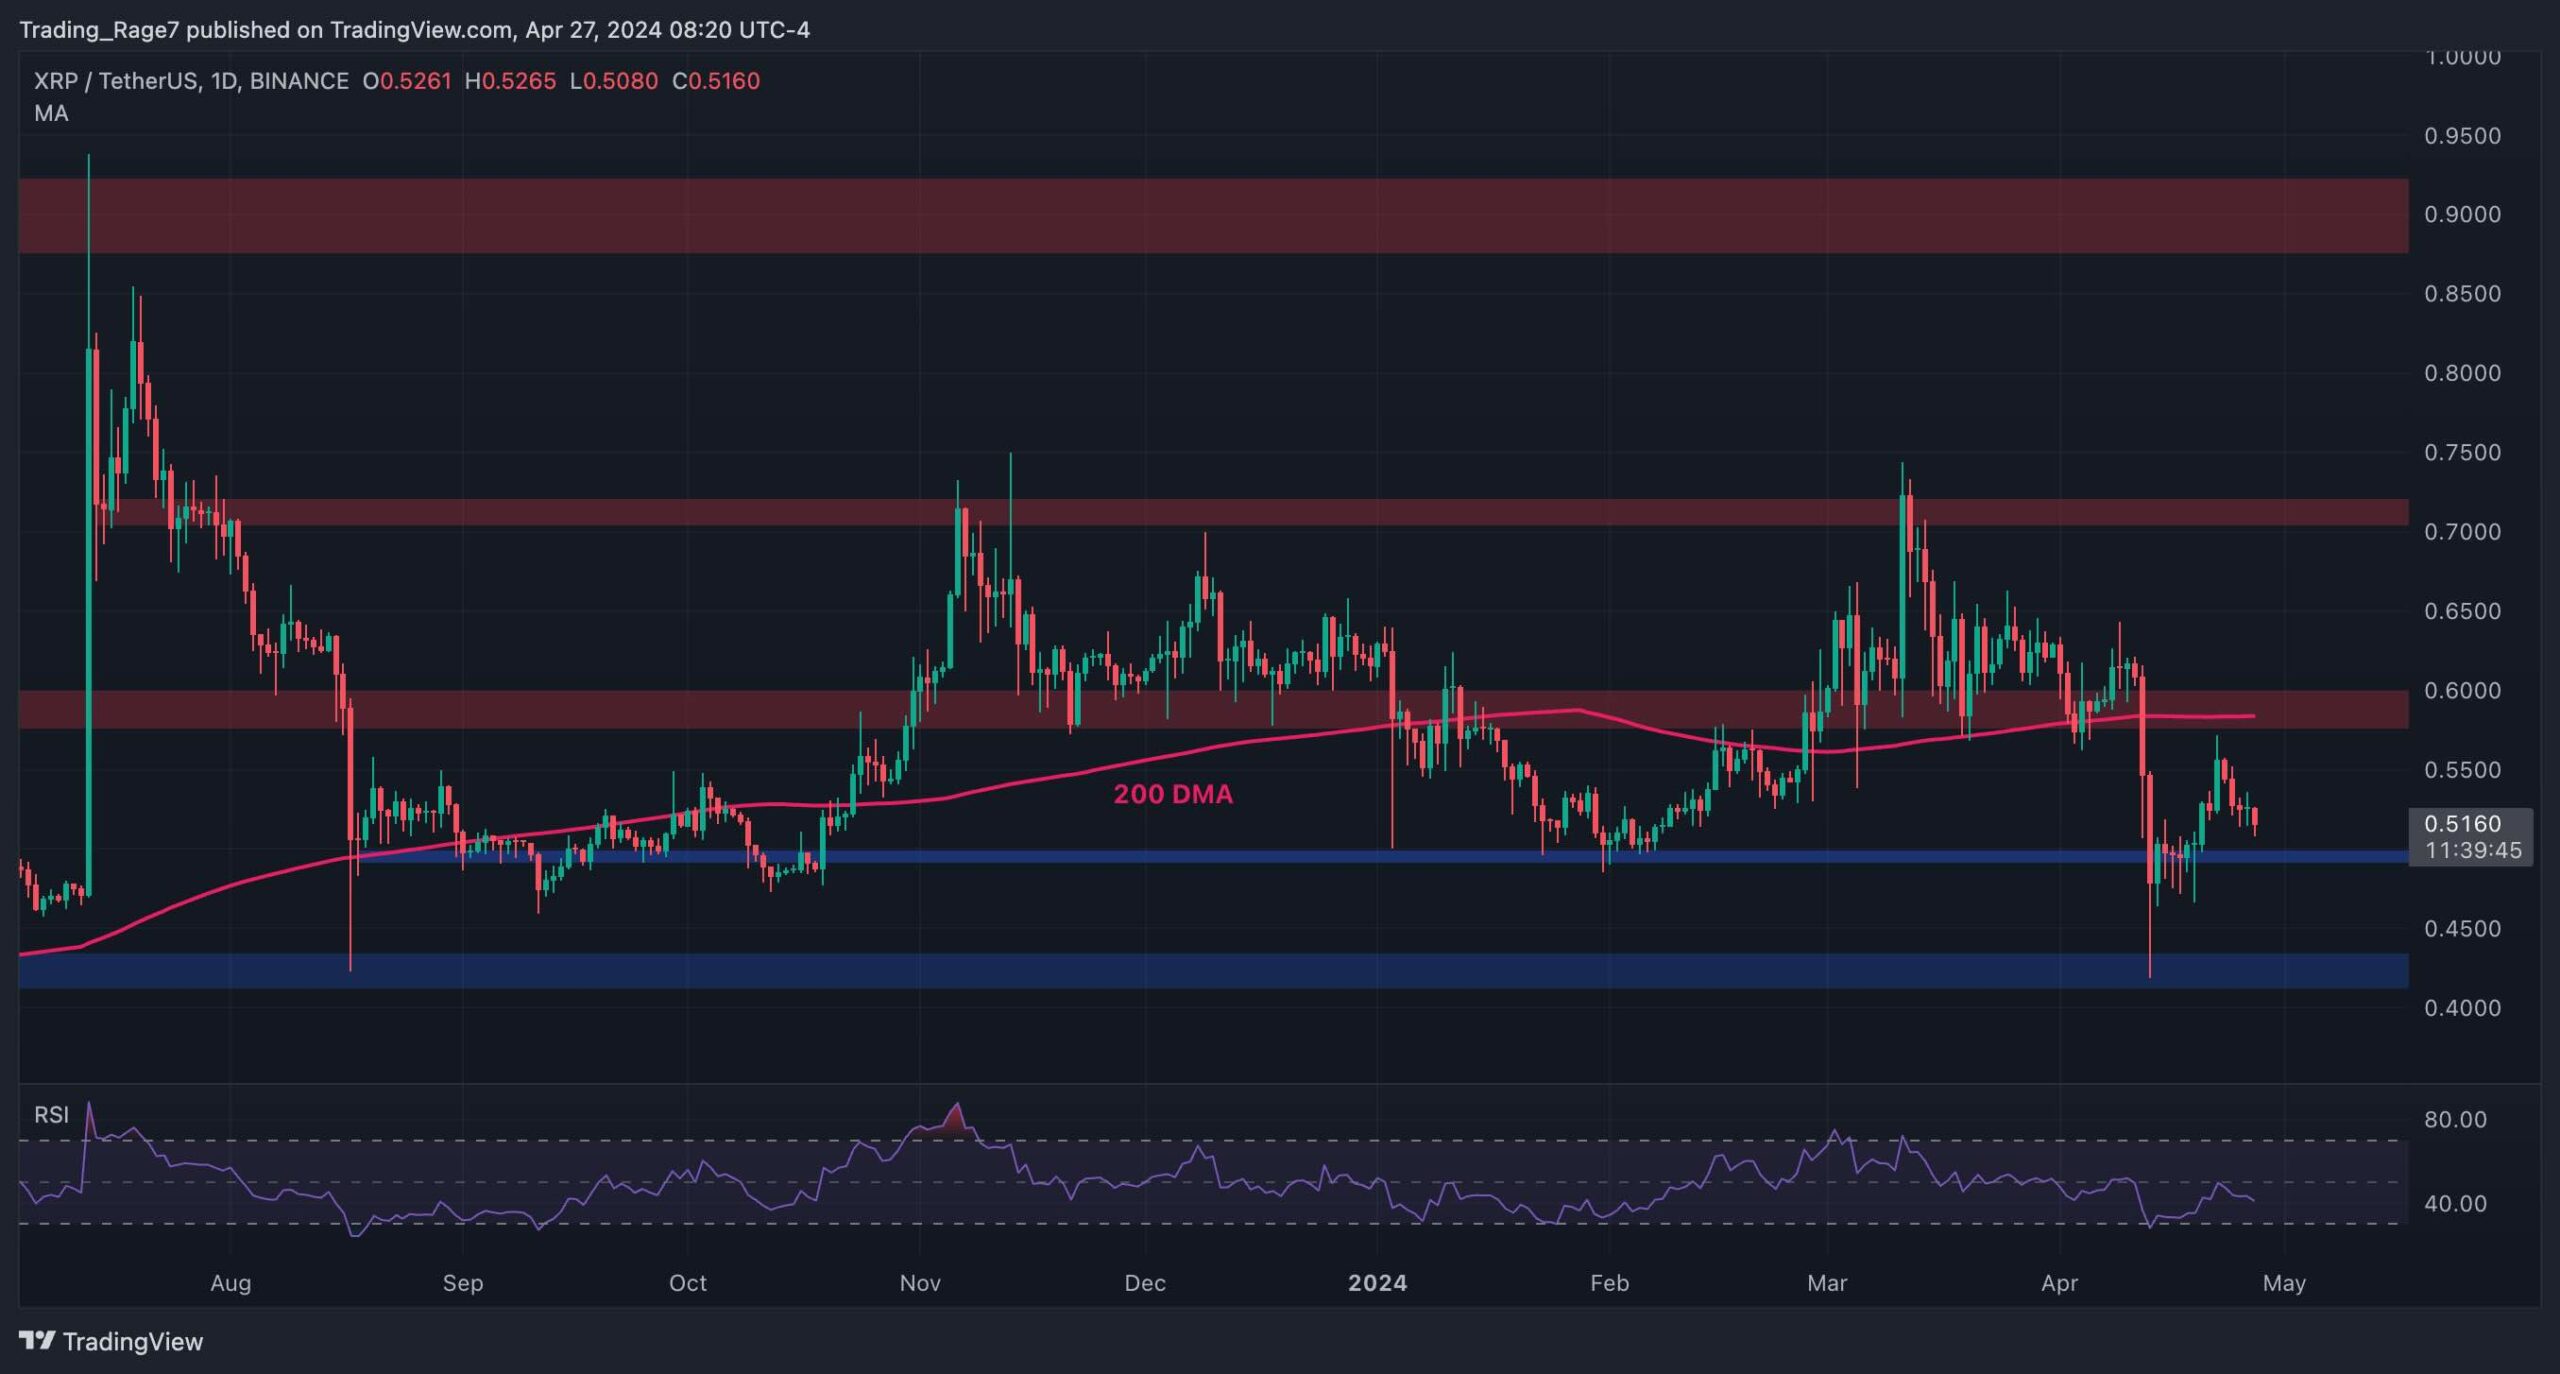
The USDT Paired Chart
Against USDT, XRP has dropped aggressively below the 200-day moving average around the $0.6 level and has yet to climb above. However, the $0.5 support zone has held the price, and the market is consolidating above it.
If the price breaks above the 200-day moving average, investors can be hopeful that a bullish trend will finally begin. On the other hand, a breakdown of the $0.5 level can aggravate the bearish trend, and the market could decline to much lower values.
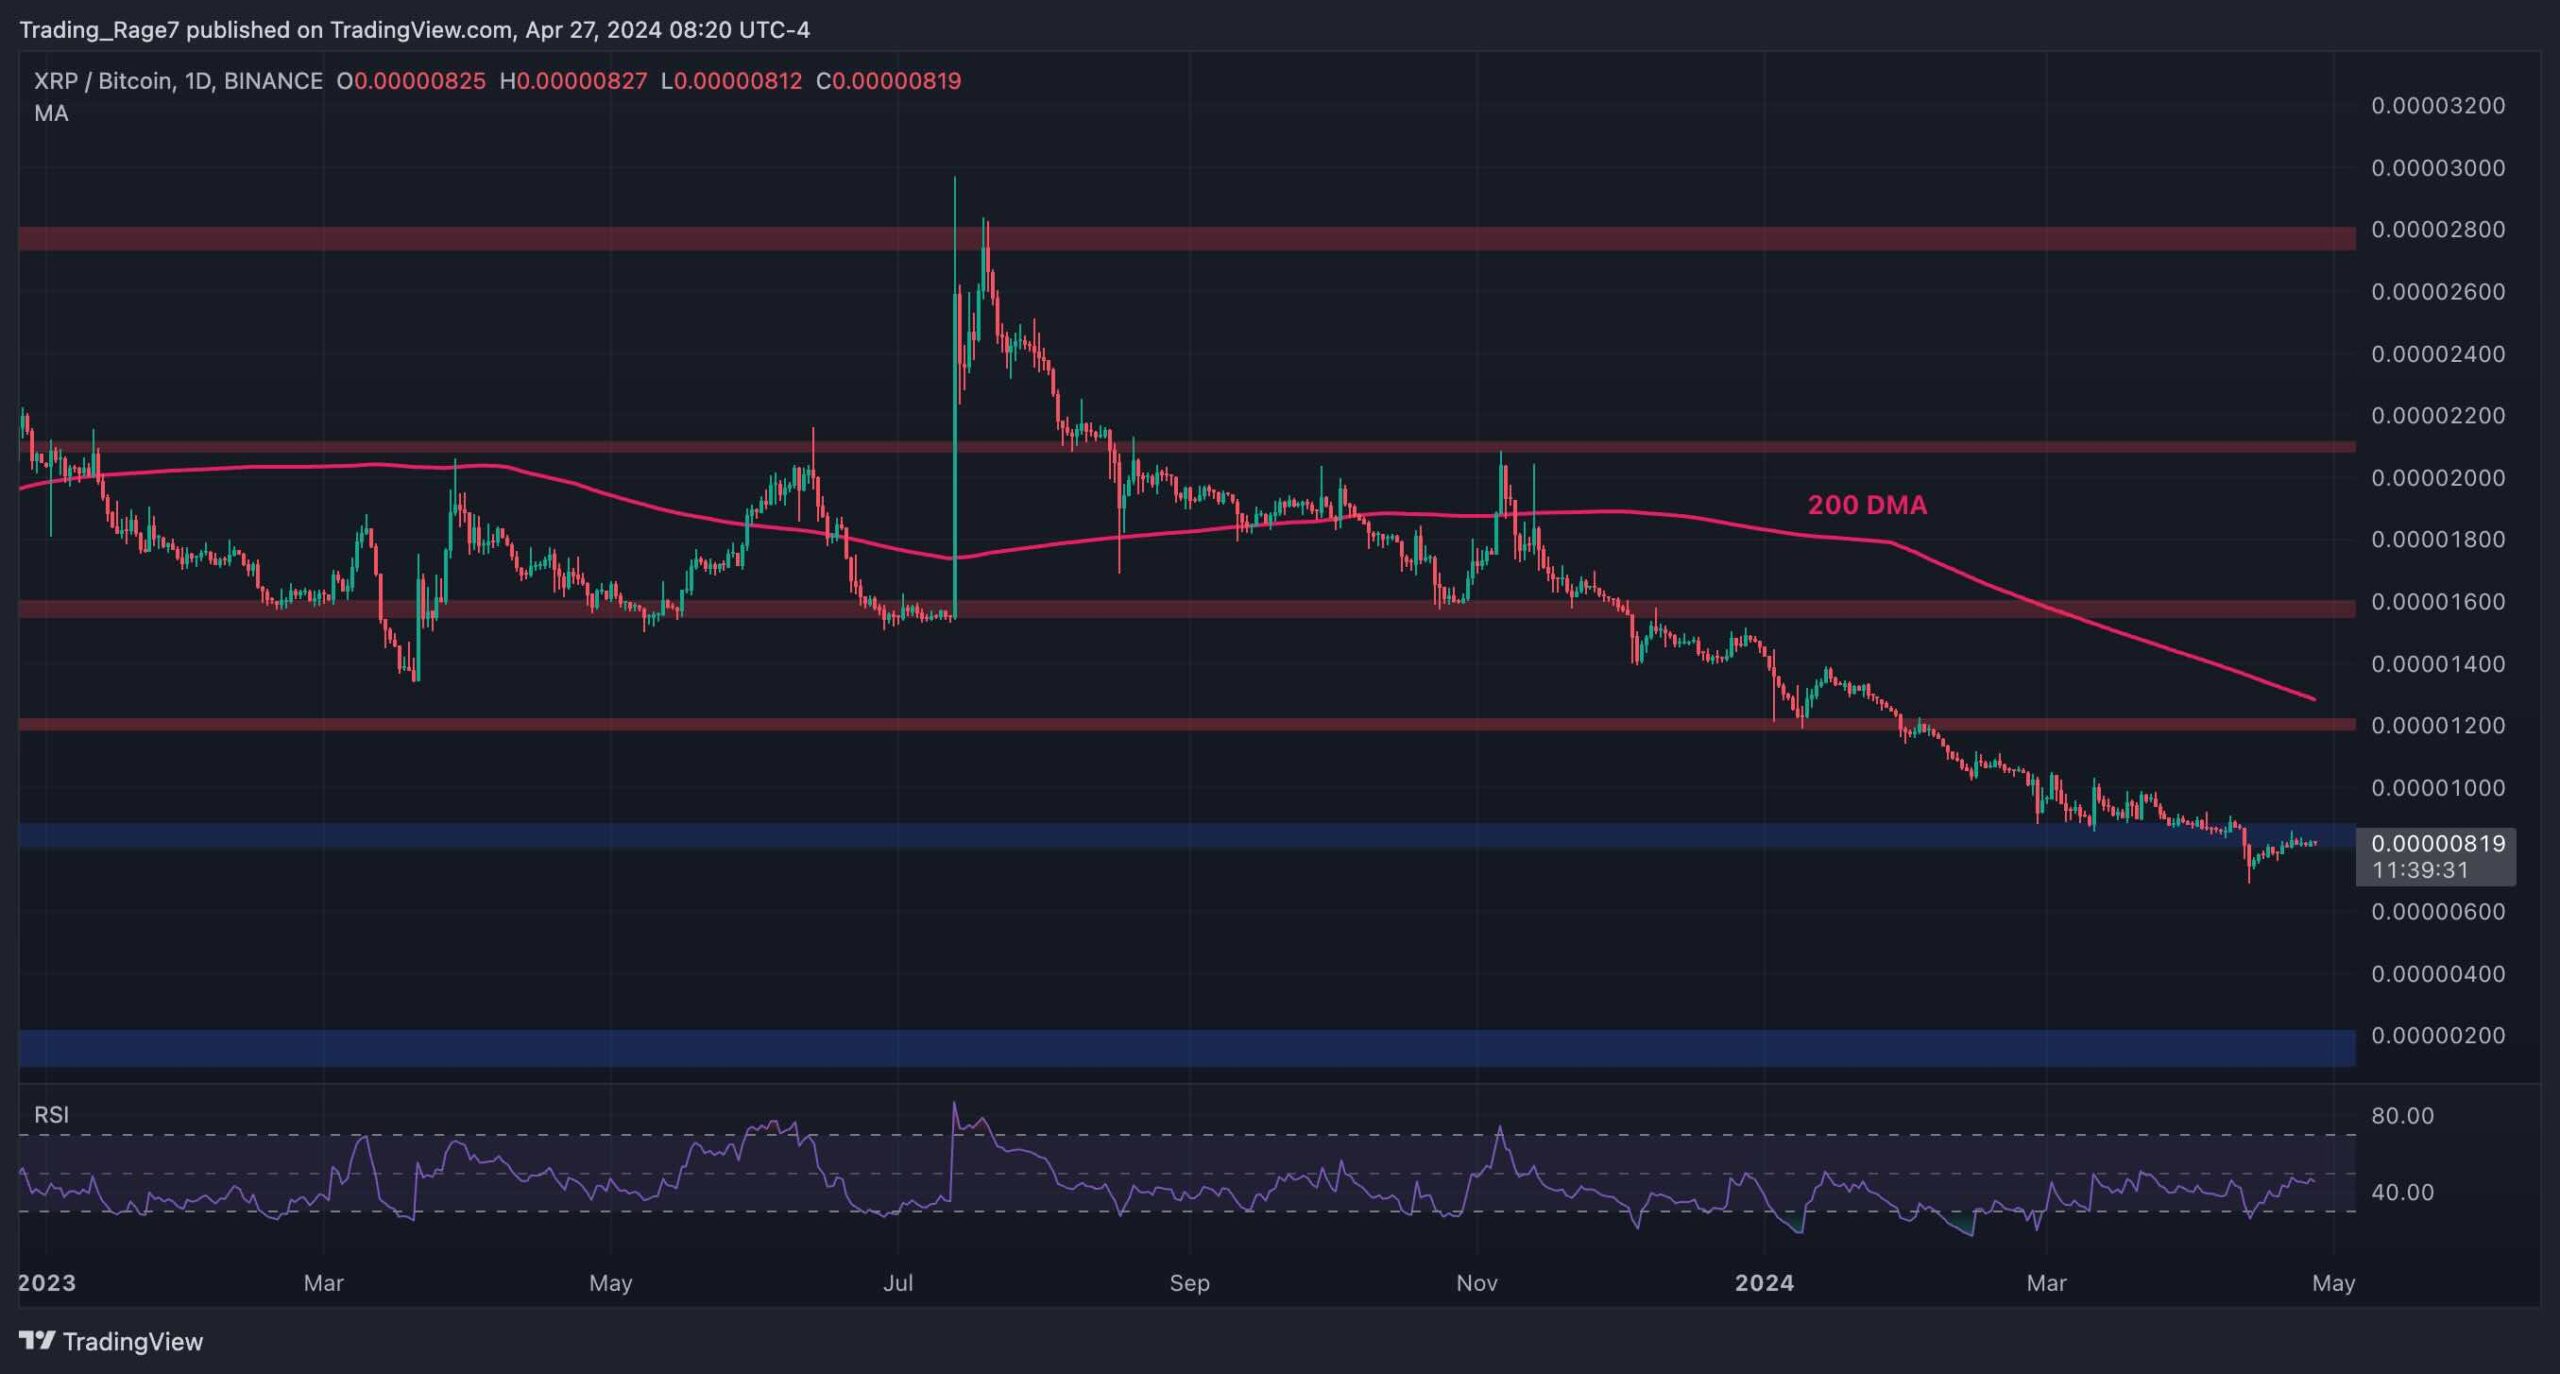
The BTC Paired Chart
Looking at the BTC pair’s daily timeframe, the price has been making lower highs and lows since the beginning of 2024. However, the 800 SAT support zone has recently held the cryptocurrency, preventing it from a further correction.
The Relative Strength Index is also sowing values below 50%, but is experiencing a recovery. If the RSI rises above 50%, the market could finally begin its rebound toward the 1200 SAT.
The post XRP Bull Run Nowhere to Be Seen as Bears Eye $0.5 Next: Ripple Price Analysis appeared first on CryptoPotato.