Two Possible Scenarios for BTC in the Next Few Days (Bitcoin Price Analysis)
Despite indications of incoming bearish price action, Bitcoin has charted a substantial increase, successfully reclaiming the critical psychological resistance of $40K. While the market reflects a robust bullish sentiment, there are signs suggesting a potential for a temporary correction.
Technical Analysis
By Shayan
Bitcoin Price Analysis: The Daily Chart
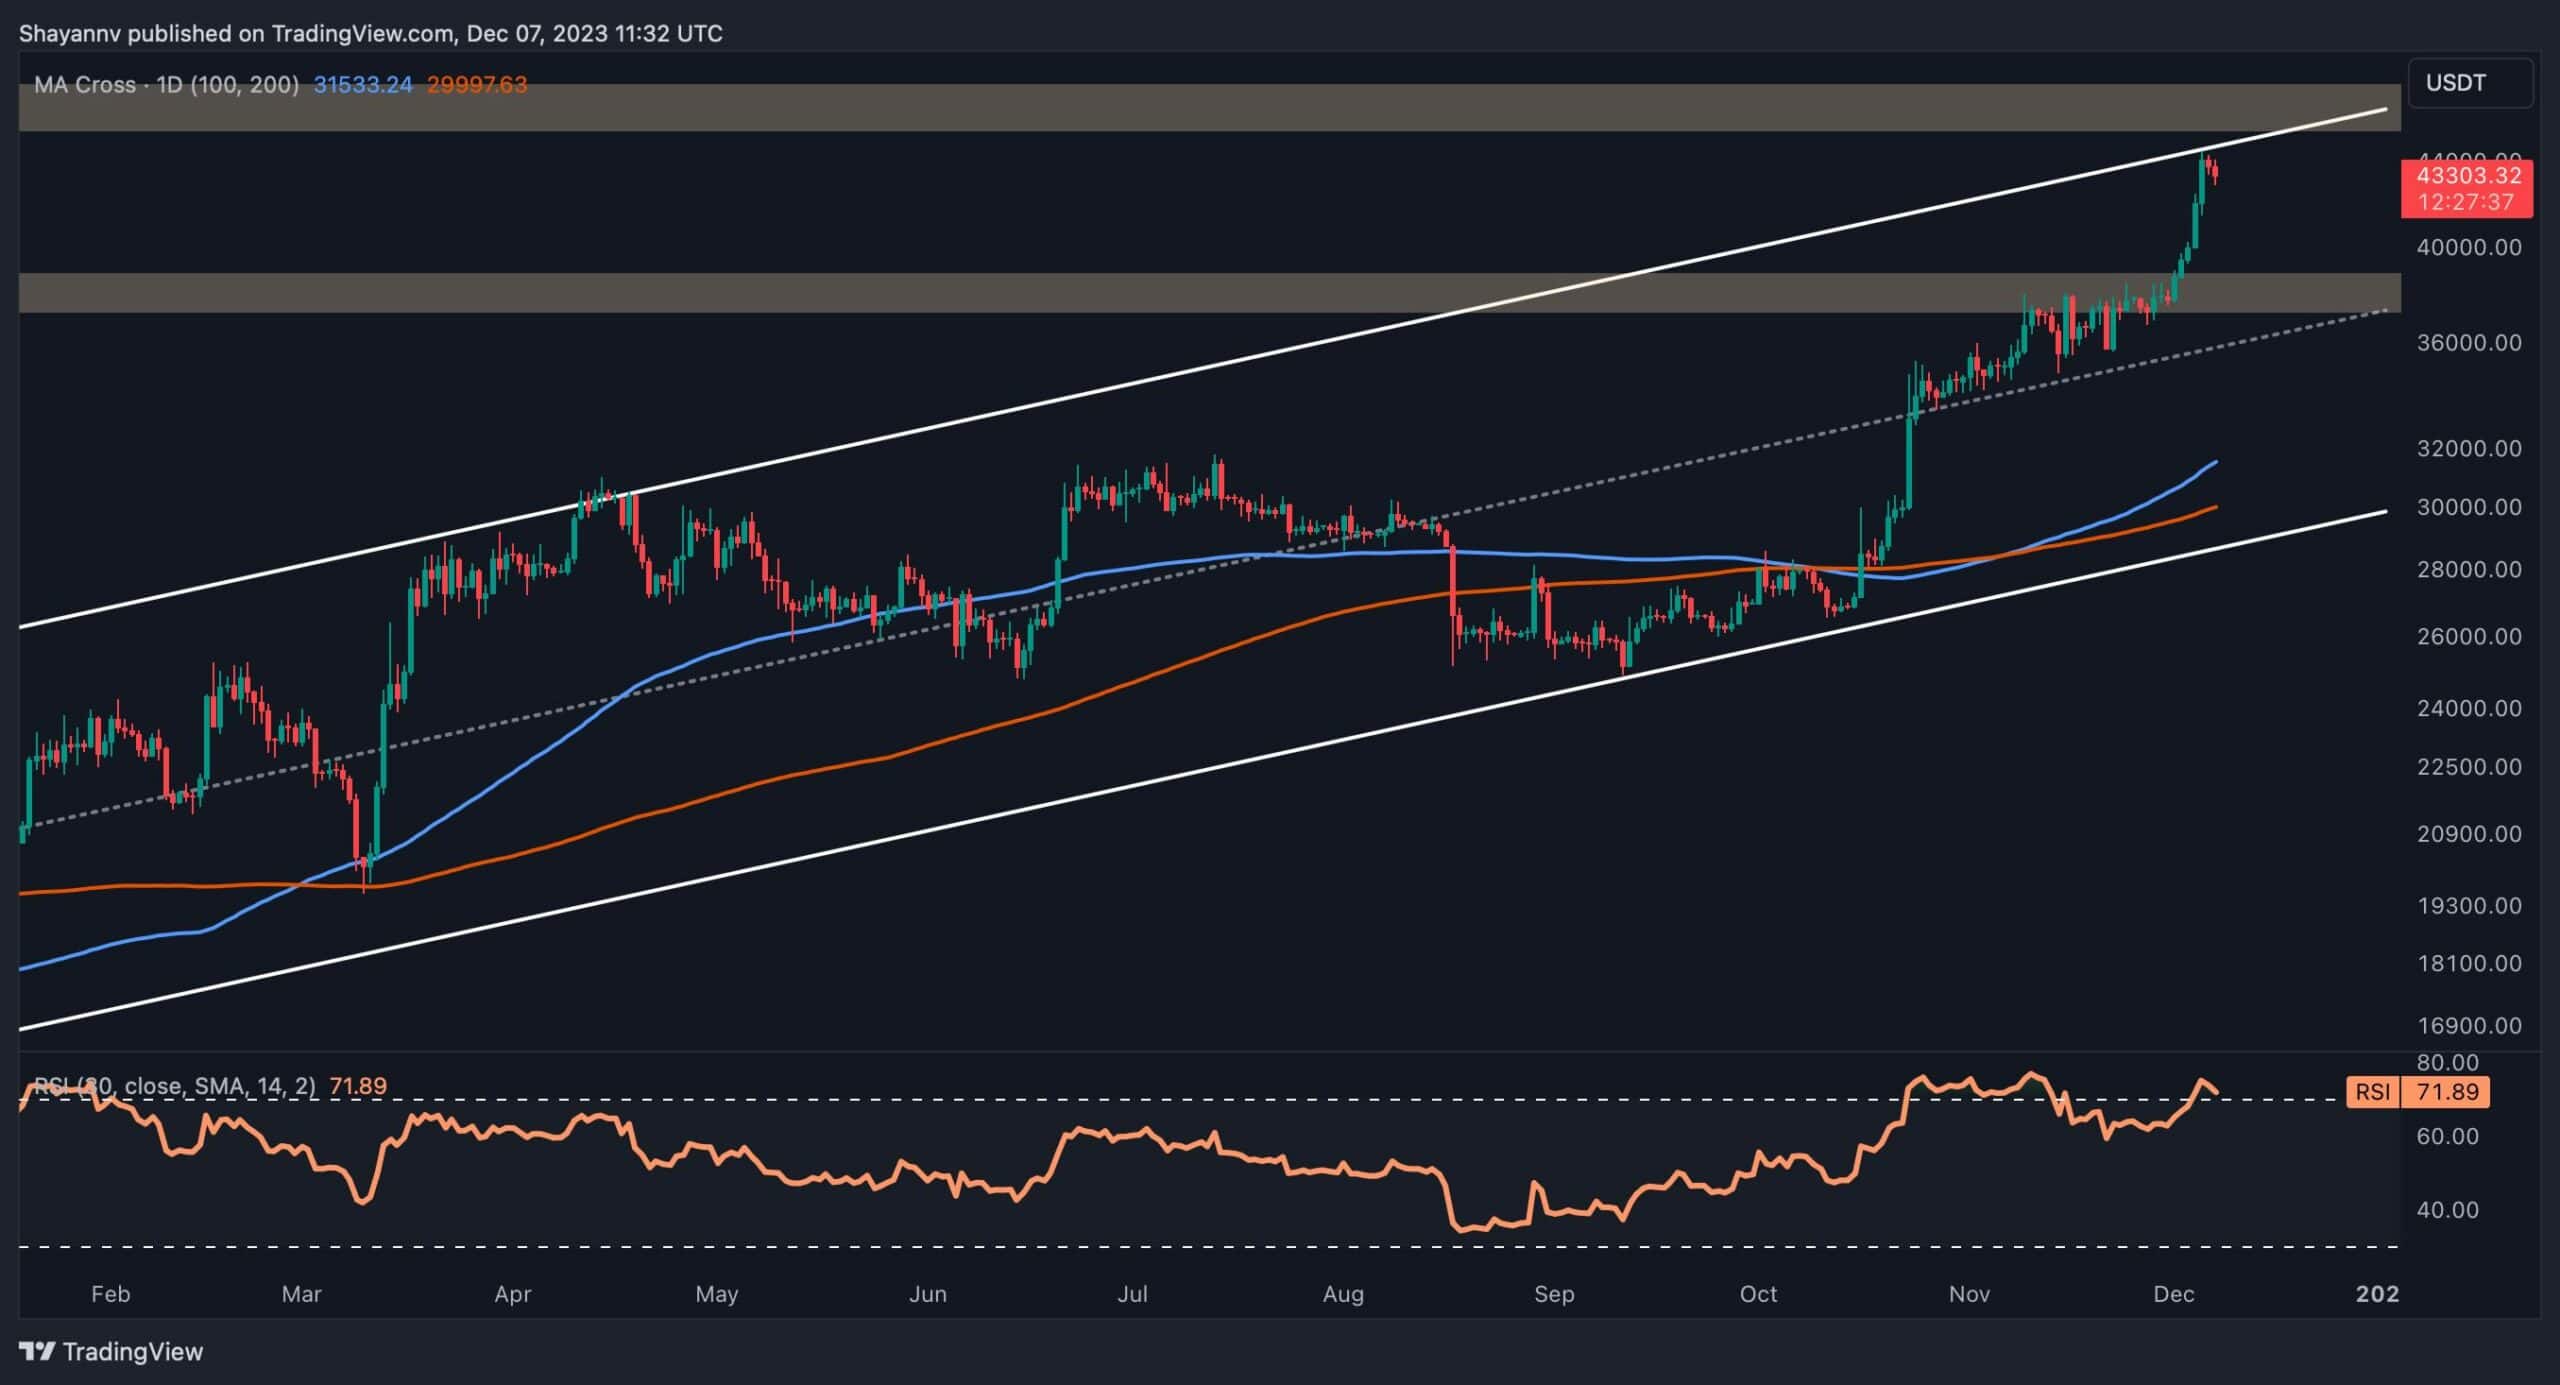
Bitcoin has maintained a strong uptrend since the beginning of 2023, consistently surpassing previous swing highs. Following a significant uptrend, the price has successfully reclaimed the crucial resistance at $40K, reaffirming substantial demand in the market.
The $40K resistance has historically posed a significant challenge for Bitcoin, and its breach indicates a notable presence of buyers.
However, the price has now reached a critical resistance zone, marked by the important $45K region and the upper boundary of a multi-month ascending channel. Consequently, the market is likely to undergo a period of consolidation correction before determining its next directional move.
BTC on The 4-Hour Chart
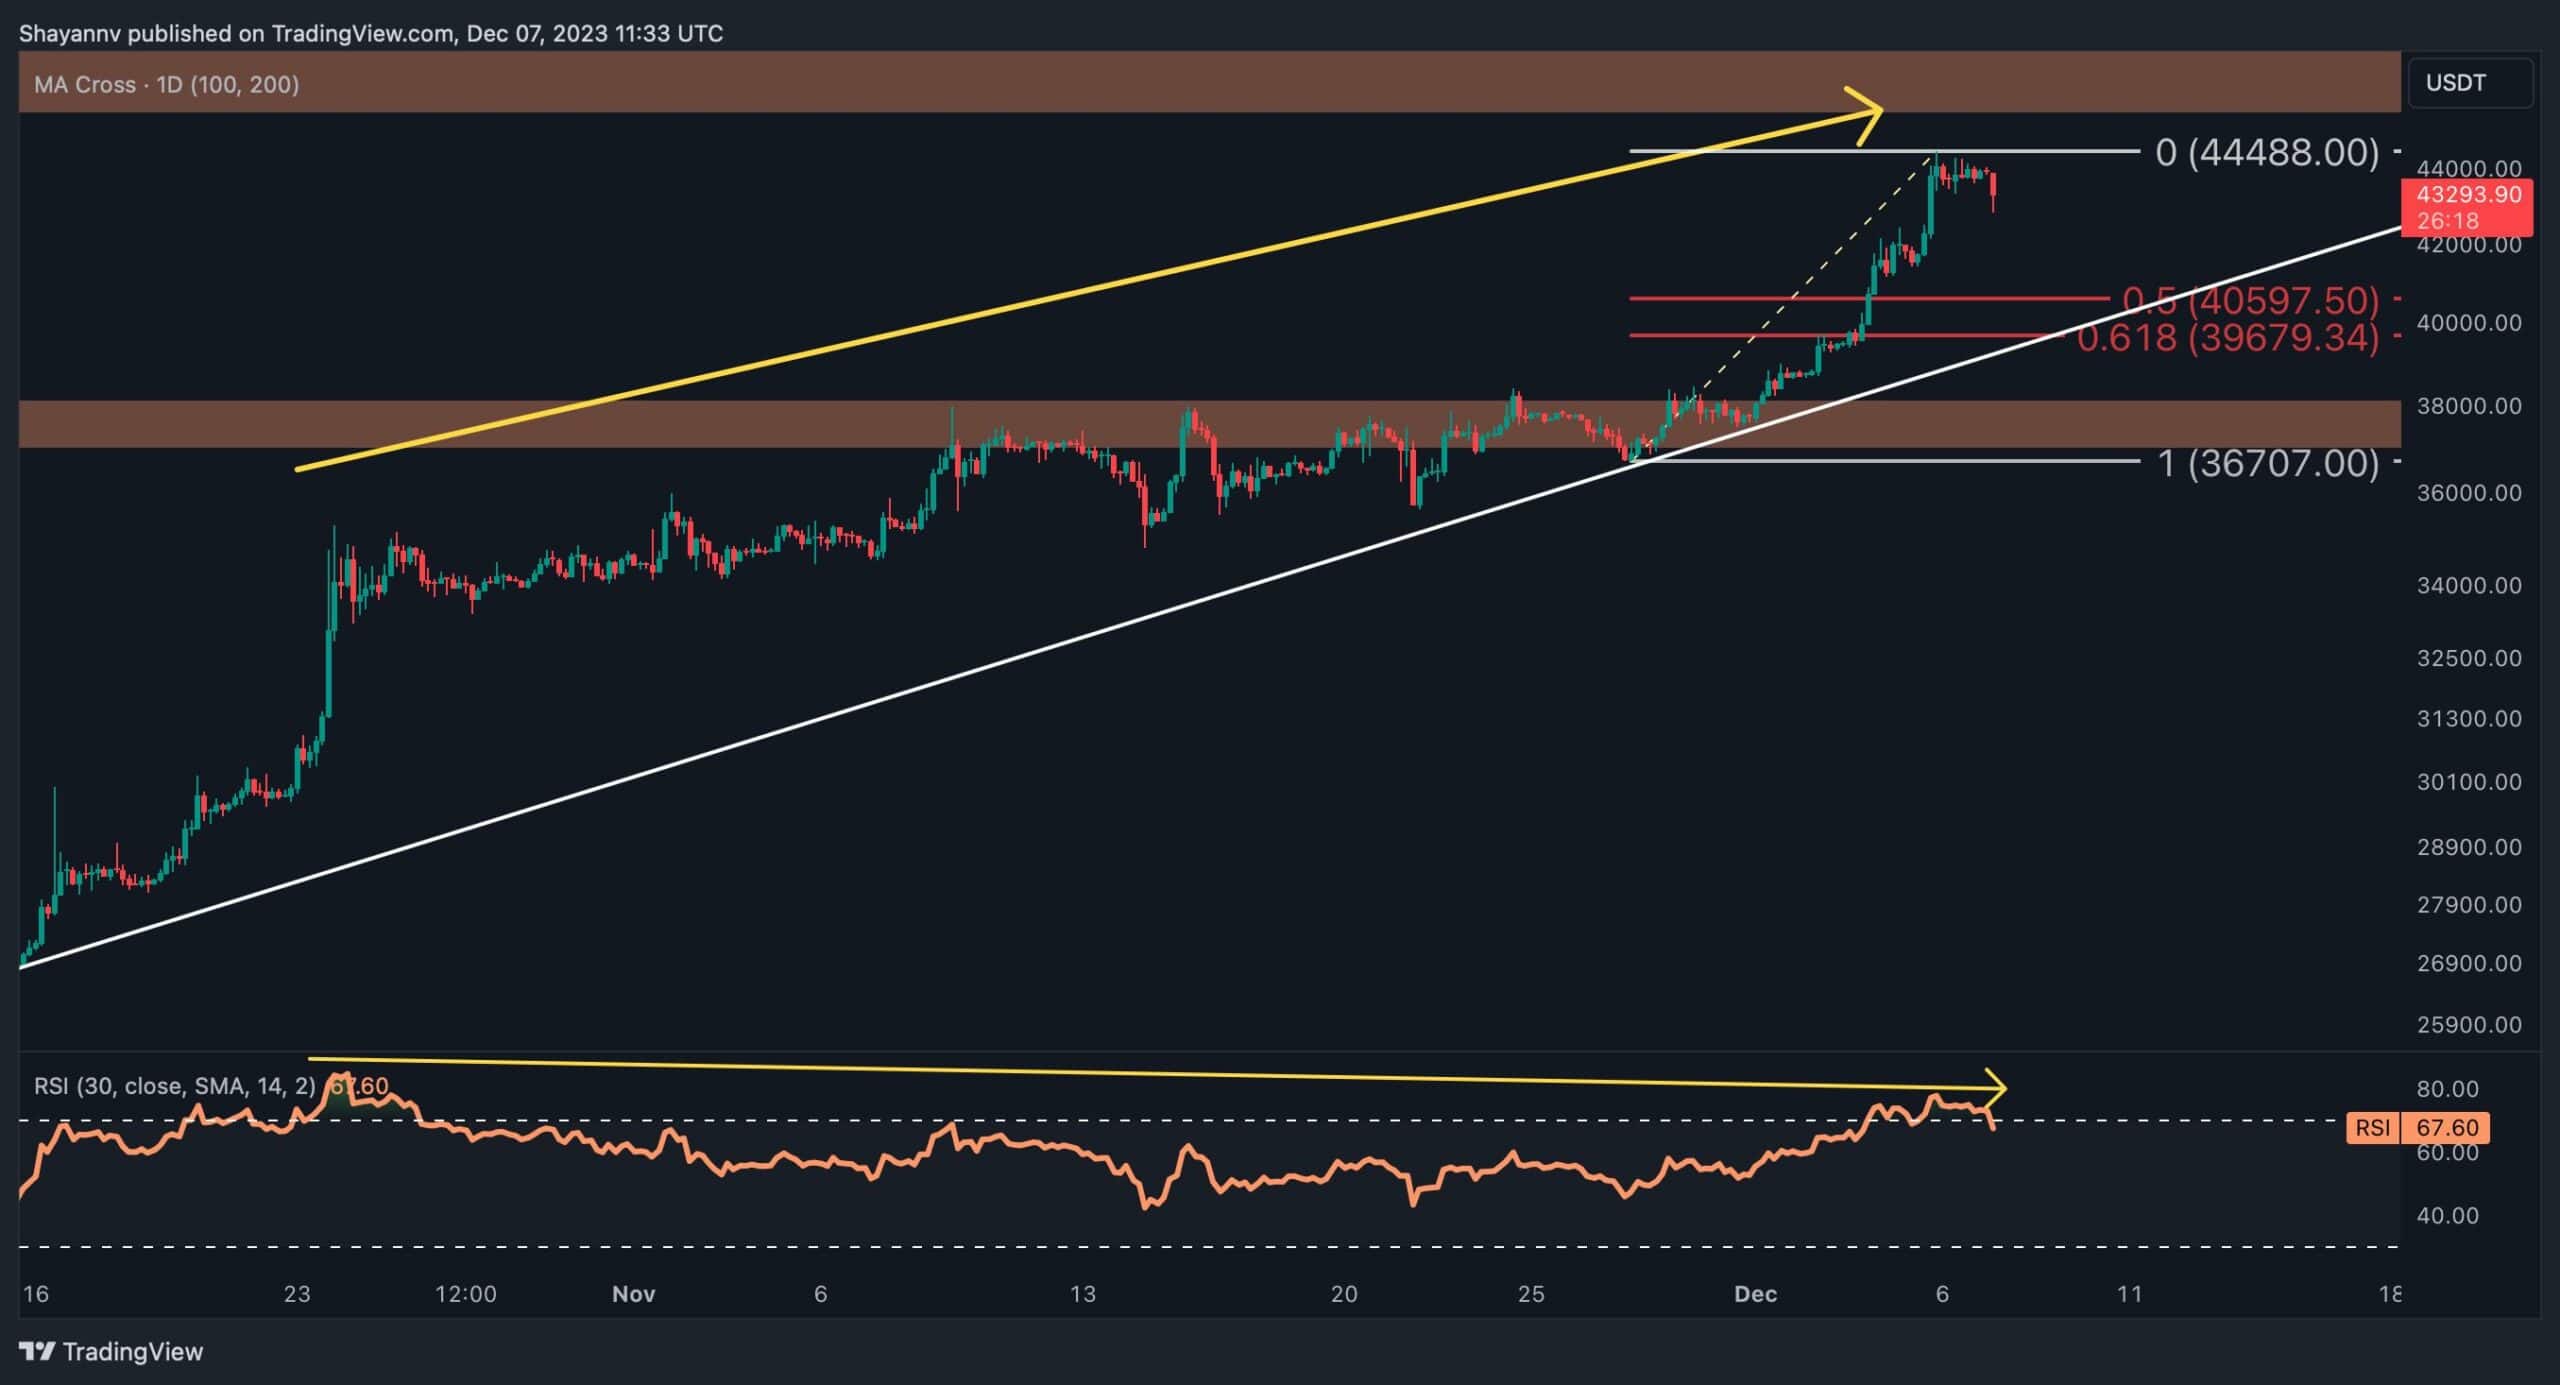
A detailed examination of the 4-hour chart unveils a phase of sideways consolidation, ultimately leading to an unexpected surge in the price. This has enabled Bitcoin to reclaim the significant resistance region of $40K.
After a slight pullback to the broken level, the price continued its upward trajectory, targeting the $45K resistance region. This range serves as a crucial barrier for Bitcoin buyers, and a successful claim of this level could lead to another impulsive surge toward the $48K resistance zone.
However, considering the existing supply near the $45K price range and the prolonged bearish divergence between the price and the RSI indicator, the market appears to require a temporary consolidation stage before determining its next move. In such a scenario, potential support levels for Bitcoin would be within the 0.5 and 0.618 levels of the Fibonacci retracement, applied to the recent impulsive uptrend.
This cautious approach considers the market’s need to establish a solid foundation before potentially continuing its upward trajectory.
On-chain Analysis
By Shayan
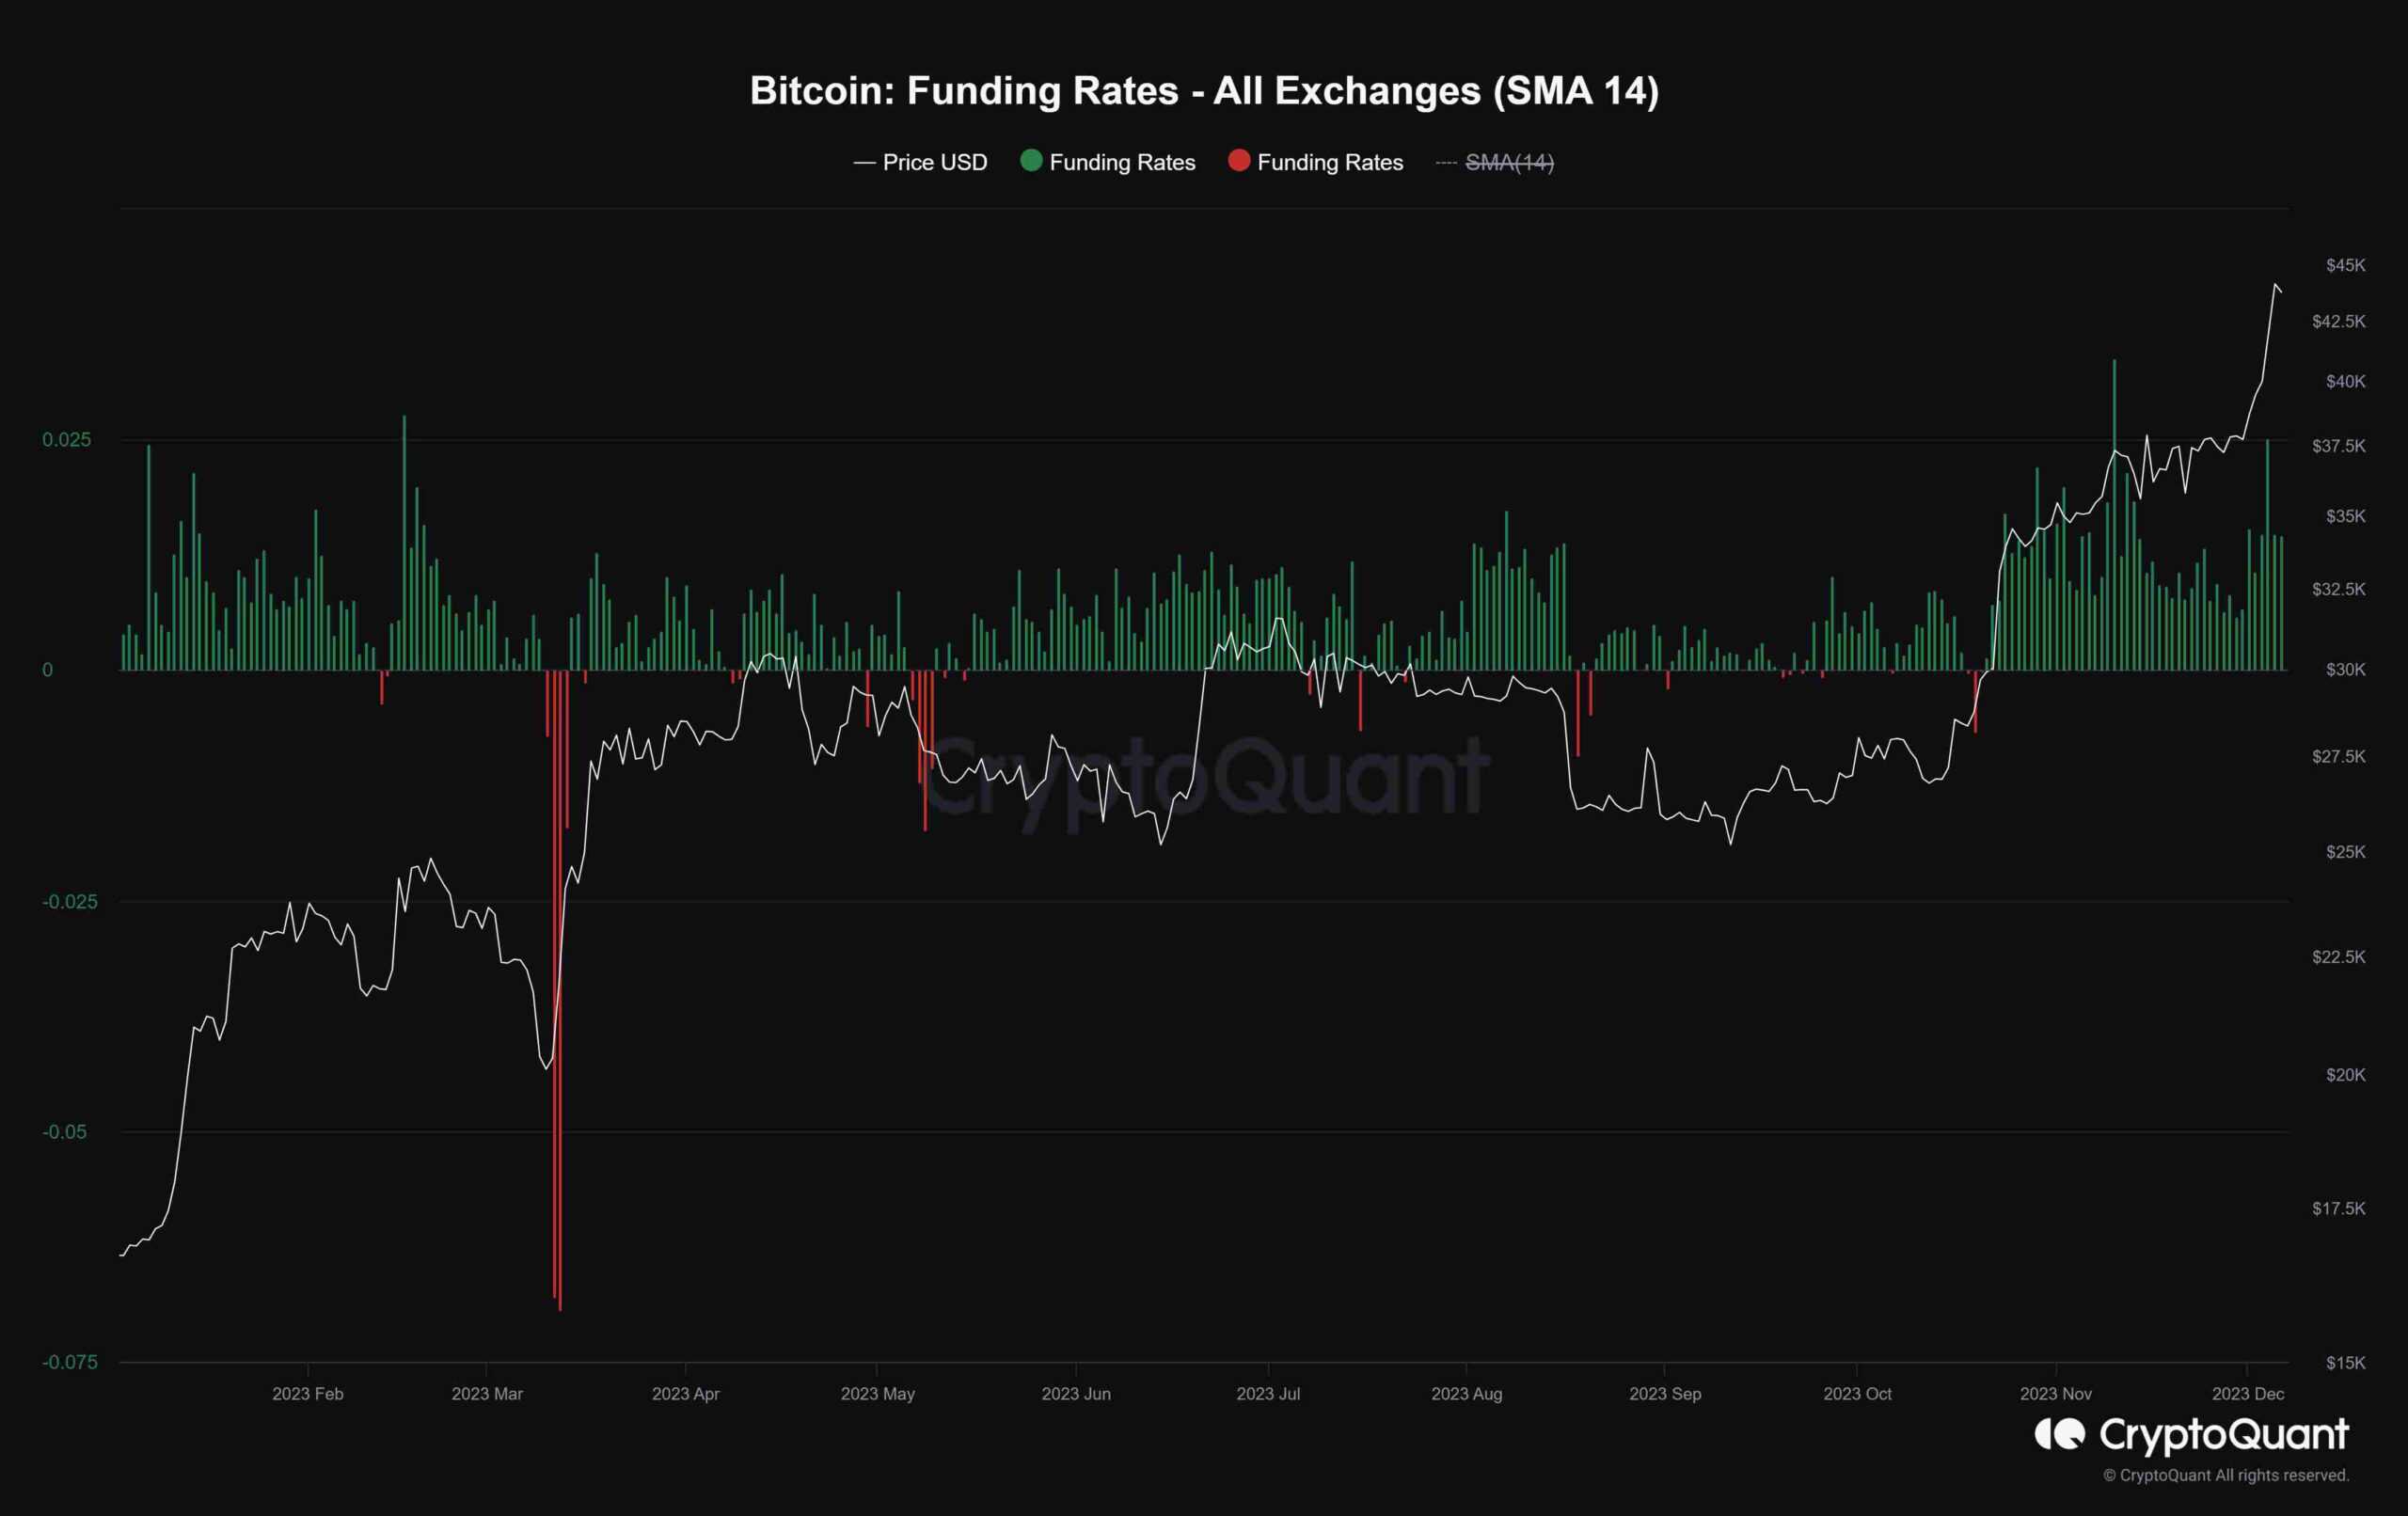
Bitcoin has experienced a significant price surge, surpassing the $40,000 threshold. However, delving into the sentiment of the futures market can provide valuable insights into the health of the ongoing uptrend and the potential direction of Bitcoin’s price in the near future.
The chart under consideration illustrates the funding rates metric, a representation of traders’ sentiment in the perpetual futures market. Positive funding rates signify the dominance of long-position traders, willing to pay funding to short traders. Conversely, negative funding rates indicate the prevalence of short-position traders willing to pay long traders.
Notably, this metric has been consistently displaying positive values concurrent with the price surge above the $40,000 mark. This suggests a significant bullish sentiment in the futures market. While a positive sentiment is generally considered favorable, it does raise concerns about the possibility of a long-squeeze event if this pattern persists. A long-squeeze event occurs when a rapid downward price movement forces traders with long positions to exit their trades, causing a temporary cascading effect.
Monitoring the funding rates closely will be crucial to gauge the sustainability of the bullish sentiment and to identify any potential risks, such as a long-squeeze event.
The post Two Possible Scenarios for BTC in the Next Few Days (Bitcoin Price Analysis) appeared first on CryptoPotato.