Make or Break for ETH: $2000 or $2500 Next? (Ethereum Price Analysis)
After a consolidation period near the $1,500 mark, Ethereum buyers returned to the market, successfully reclaiming the $2K resistance region.
However, following a notable surge, ETH has encountered a crucial price range, and it’s currently struggling to overcome it.
Technical Analysis
By GreatestTrader
The Daily Chart
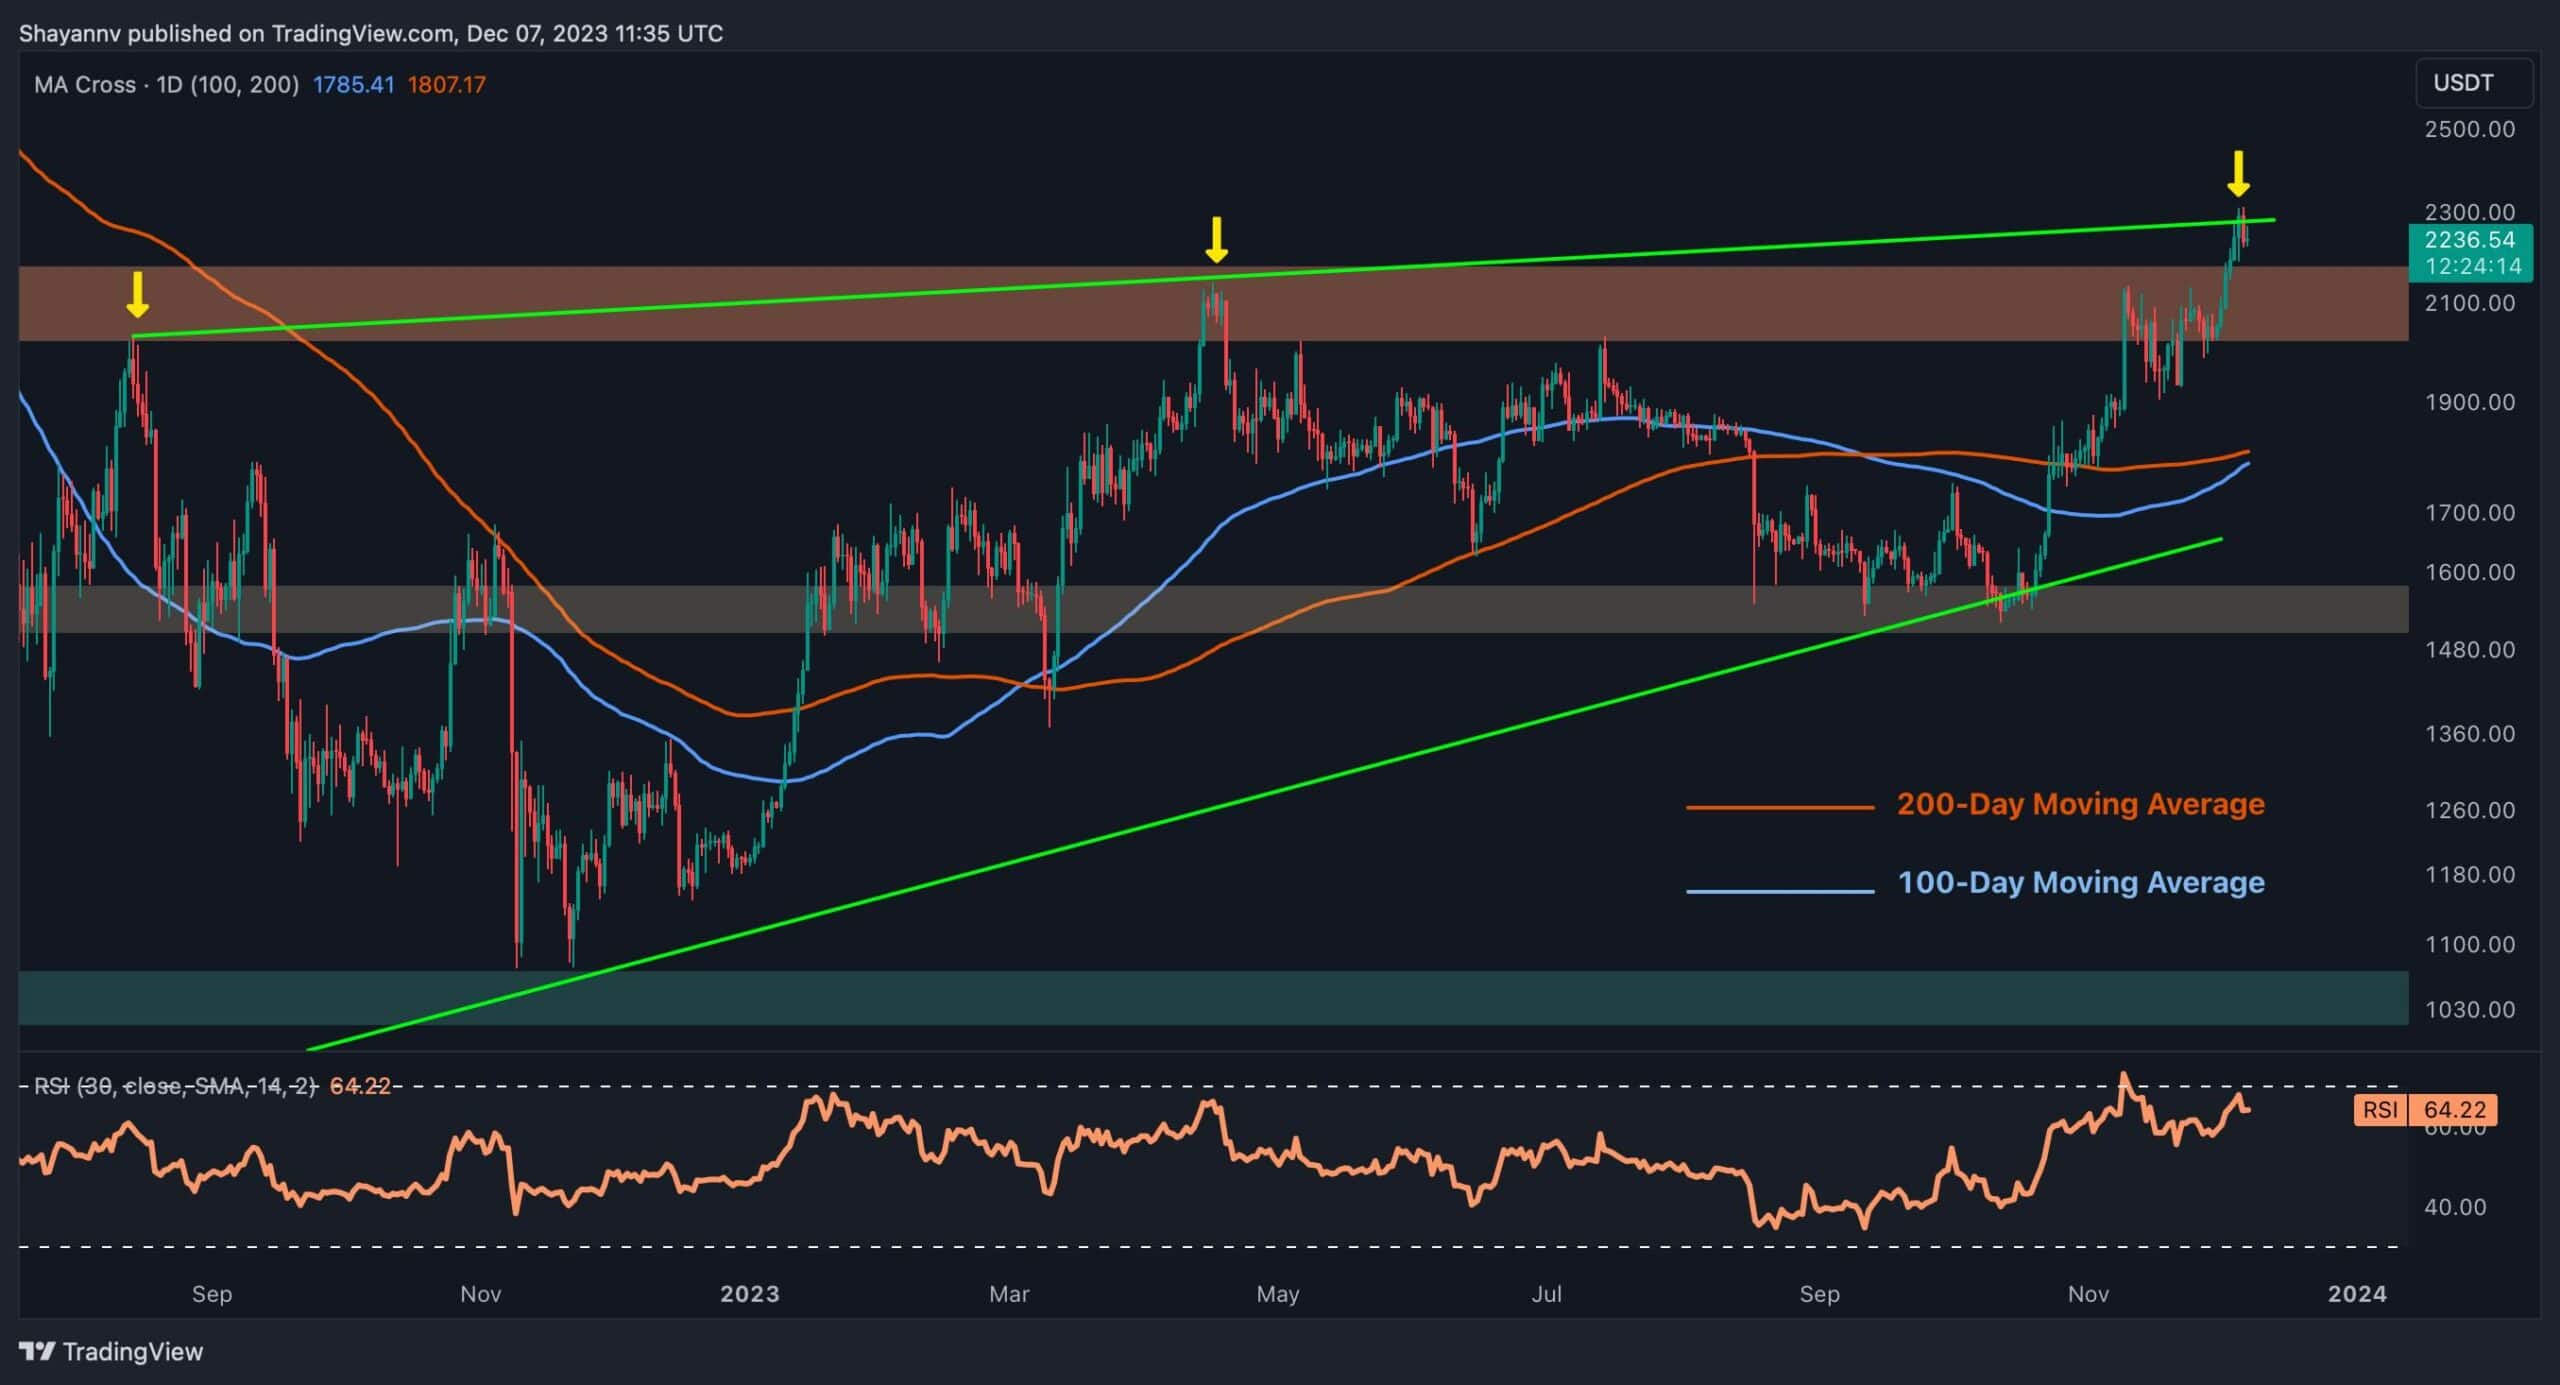
Over the past two months, Ethereum has enjoyed a positive trend, consistently moving upward. Accordingly, the increased buying pressure facilitated the surge above the significant $2K resistance, leading to a continued rally. Consequently, the ETH price has recently experienced a sharp increase, targeting the crucial $2.3K resistance region.
This price range presents a substantial obstacle for Ethereum buyers, encompassing the static resistance at $2.3K and the dynamic resistance of the upper trendline of the Wedge.
The trendline has proven to be a significant barrier on three occasions, hindering Ethereum’s uptrends. However, should the price successfully reclaim this crucial region, the $2.5K mark could be the next destination for Ethereum.
The 4-Hour Chart
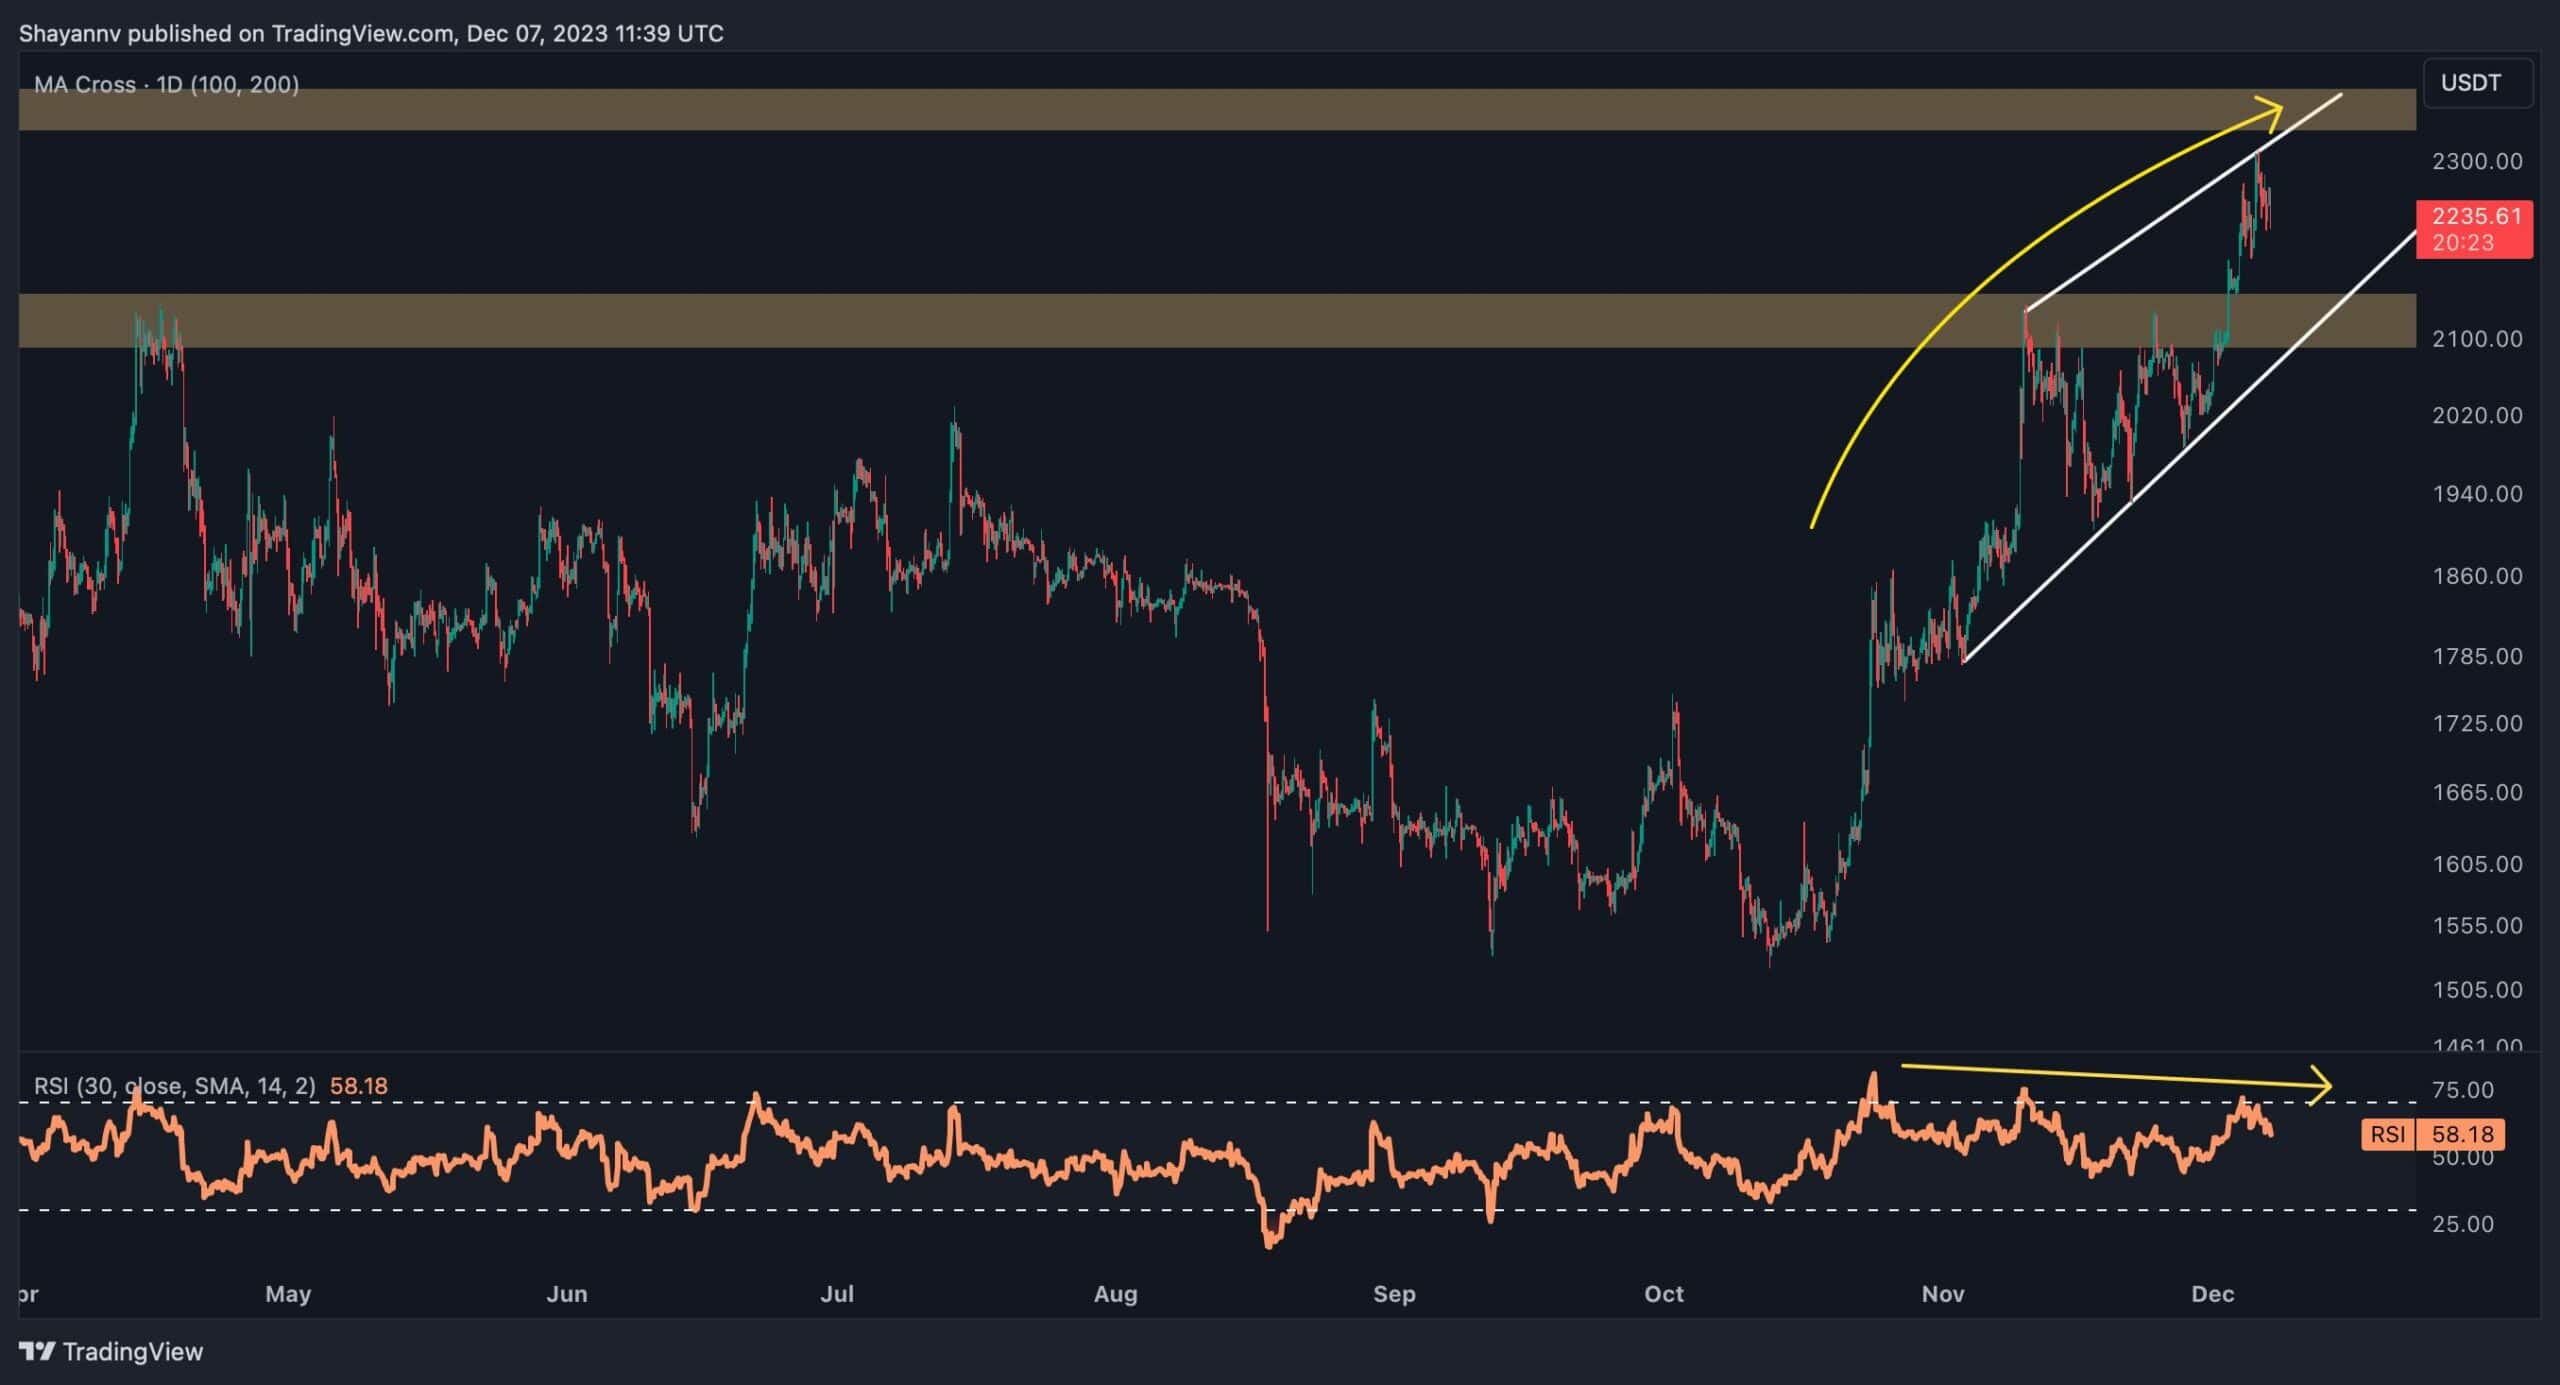
Examining the 4-hour chart reveals that after finding support near the $1.5K mark, Ethereum initiated a robust uptrend, indicating the dominance of buyers. This resulted in a substantial surge, breaking through multiple resistance levels, including the critical $2K resistance.
However, upon reaching the pivotal $2.4K resistance region, the uptrend lost momentum, and the price formed an ascending wedge pattern.
Concurrently, a bearish divergence between the price and the RSI indicator expanded over two months, suggesting a potential overvaluation of Ethereum at this time.
Given the current market dynamics, while the overall sentiment is bullish and buyers appear to be in control, there is a notable probability of a temporary consolidation correction phase in the short term, accompanied by increased volatility.
However, in the event of a sudden breakout above the decisive $2.4K resistance zone, the market could witness a substantial surge, potentially trending toward higher resistance levels.
On-chain Analysis
By GreatestTrader
Ethereum’s price has recently demonstrated a significant upward trajectory, marking a departure from months of consolidation and gradual decline.
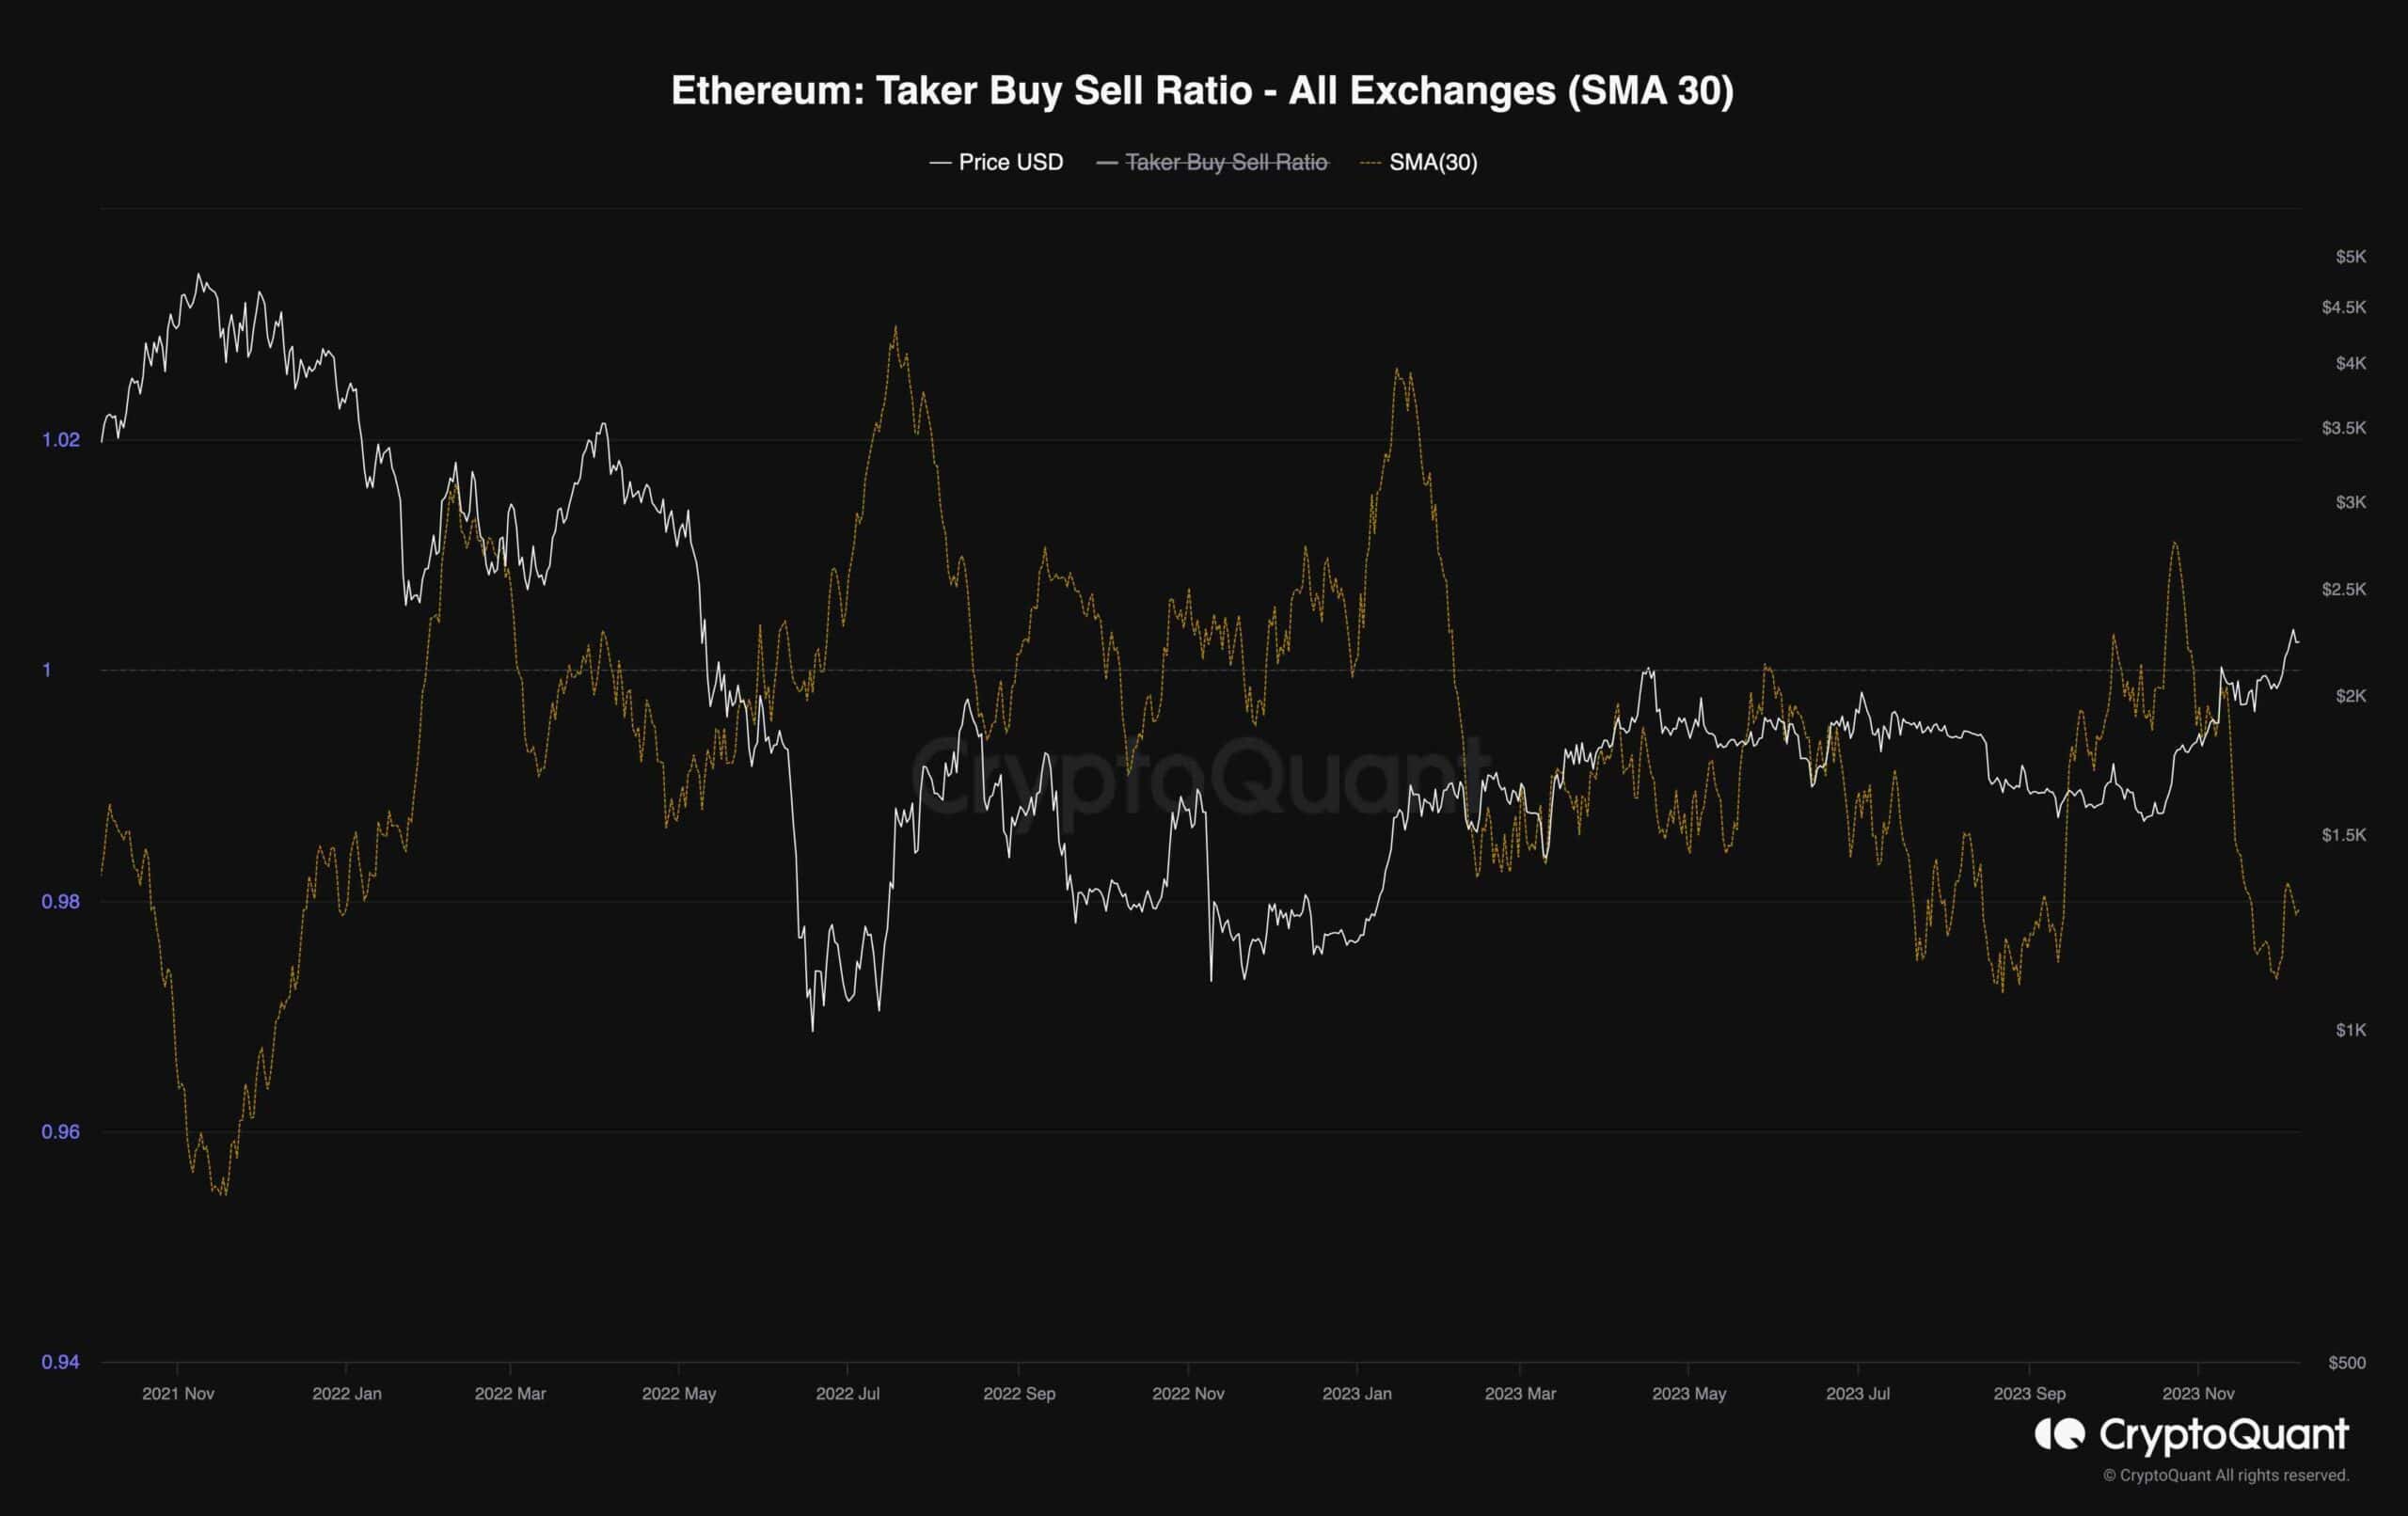
This surge has engendered a notable bullish sentiment, reinstalling demand within the market. The accompanying chart illustrates the 30-day moving average of the taker buy-sell ratio metric, a valuable indicator for gauging futures market sentiment. In this metric, values below 1 signify a bearish sentiment, while values above 1 are indicative of a bullish sentiment.
Interestingly, the taker buy-sell ratio metric has exhibited a noteworthy decline, falling below 1 concurrently with Ethereum’s substantial surge to higher price levels. This development suggests the possibility of an impending correction stage, as the significant decline in the metric implies that participants may view this price range as an opportunity to secure profits by selling their Ethereum holdings.
Therefore, there is the potential for the market to undergo a phase of consolidation correction before determining its next course of action. This cautionary note is rooted in the observed divergence between the surging price and the declining taker buy-sell ratio, signaling a potential shift in market dynamics.
The post Make or Break for ETH: $2000 or $2500 Next? (Ethereum Price Analysis) appeared first on CryptoPotato.