Time For $9000? Bitcoin Records a New 2019 High: BTC Price Analysis & Next Targets Overview
As in crypto, following our past week’s analysis, Bitcoin didn’t disappoint its fans and provided the anticipated significant move, and yes, it’s a green bullish move.
The king of the cryptocurrencies had reached a new yearly record, as well as a new 2019 high after breaking up the $8400 level following a reasonable bullish candle.
In a little more than an hour, Bitcoin surged $800 to capture $8800 resistance as the new 2019 high, as of writing this.
As always during the past few weeks, we get significant sharp moves during the weekend. As mentioned before, the trading volume during the weekends is a lot fewer than the volume of weekdays; hence, it’s a lot easier to move the crypto markets.
Following the breakout of the past high at $8400, Bitcoin breached $8600 to the next resistance level (as mentioned on our previous analysis) of $8800. As of writing this, the coin got rejected there, to gain power for its next wave.
Total Market Cap: $264 Billion
Bitcoin Market Cap: $151 Billion
BTC Dominance: 57.3%
Looking at the 1-day & 4-hour charts
– Support/Resistance:
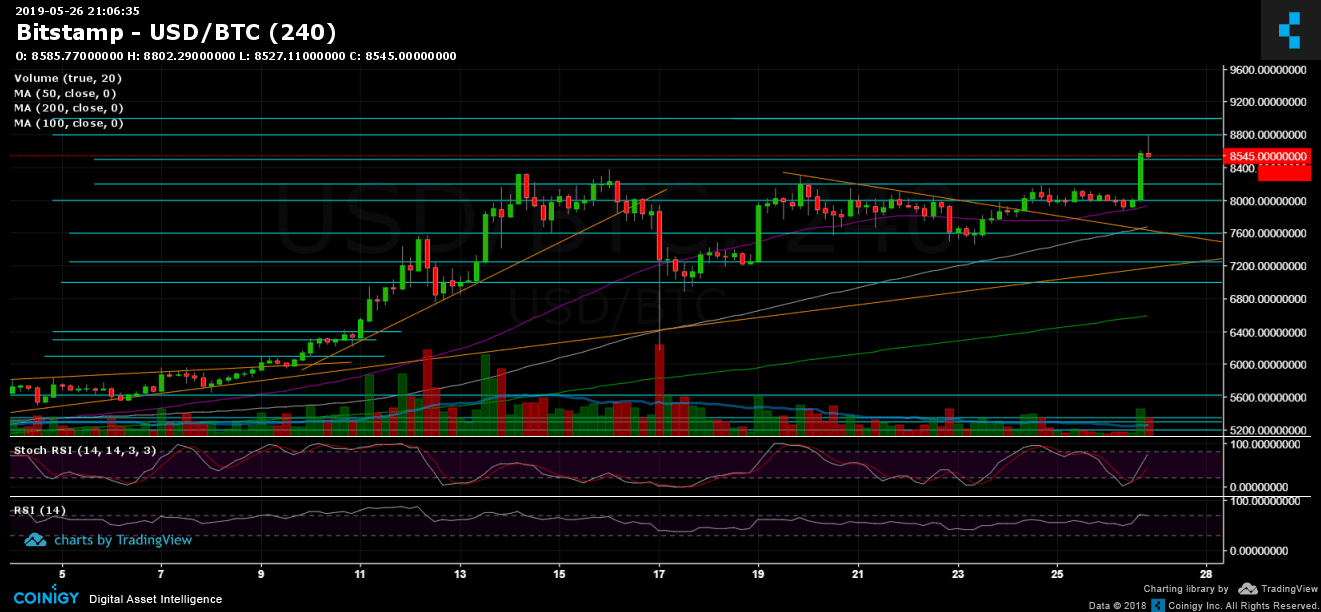
From above, the $8800 is now the next major resistance Bitcoin faces. Above lies the $9000 resistance mark, then $9200 – $9300 level, before reaching the $9700 – $9800 area which was the high of May 2018, and that is the last barrier before BTC returns to 5 digits.
From below, $8600 is the closest support level. Below lies $8500 and the significant previous high at $8400, $8200 and $8000. Further below is $7800 and $7600 (this week’s low).
– Trading Volume: As mentioned above, the trading volume is high, however, not much of a breakout. This can be explained due to the weekend.
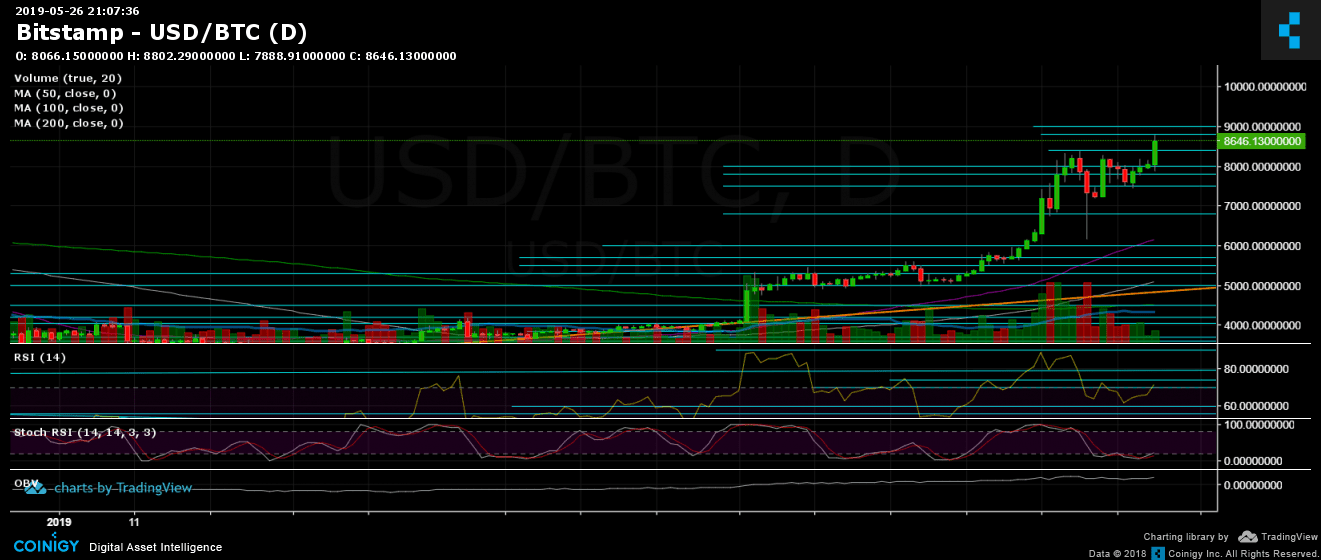
– Daily chart’s RSI: The RSI is now facing the 74 bullish levels, after getting support at the 60 area. As mentioned in our last analysis: “A bullish sign might be coming from the Stochastic RSI oscillator, as it was recently crossing over in the oversold area.”
– BitFinex open short positions: The last bullish move didn’t blow up short positions, however, since touching $8800 we see the shorts number increasing as it currently stands at 20.5 K BTC open short positions.
BTC/USD BitStamp 4-Hour Chart
BTC/USD BitStamp 1-Day Chart
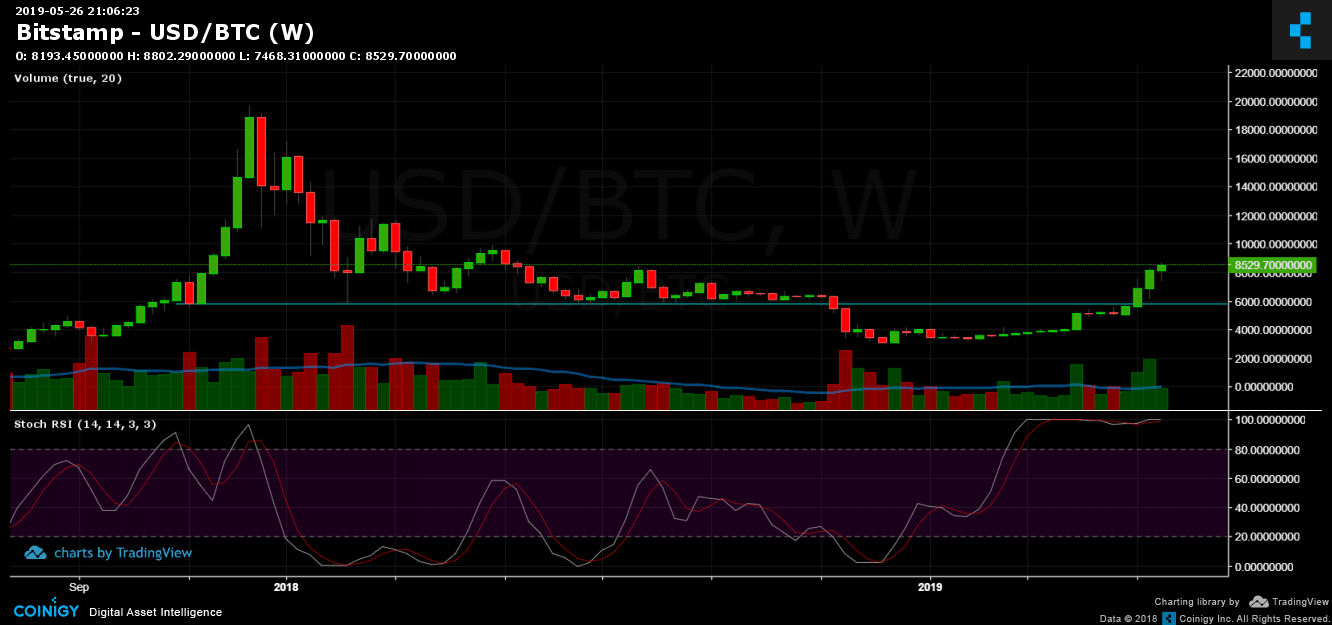
BTC/USD BitStamp 1-Week Chart
The post Time For $9000? Bitcoin Records a New 2019 High: BTC Price Analysis & Next Targets Overview appeared first on CryptoPotato.