Bitcoin Price Analysis Dec.17: Nice $200 Breakout. Could This Start a Reversal?
Over the past two days since our previous Bitcoin price analysis, the coin had been trading around the $3200 mark.
However, the falling wedge we’ve talked about has just now shown signs of a nice breakout: and, good news, to the upper side. An impressive green candle from the past hour, as of writing the analysis, spikes Bitcoin over the $3400 resistance mark.
Could this turn into a further bullish correction? I would definitely consider this option. It depends on the volume of the buyers: So far today, the volume is relatively low.
An interesting thing to see is the Bitfinex short positions’ chart. Every time the shorts number is passing the 40K mark, the bulls would seek to trigger a short squeeze. As of ,now, the short squeeze erased only 2% of the open positions. Imagine what would happen if 10% of the shorts will get liquidated at one moment.
To summarize, this could start a deeper positive correction, but it’s too early to declare on an end to the way too long bear market.
Looking at the 1-day & 1-hour charts
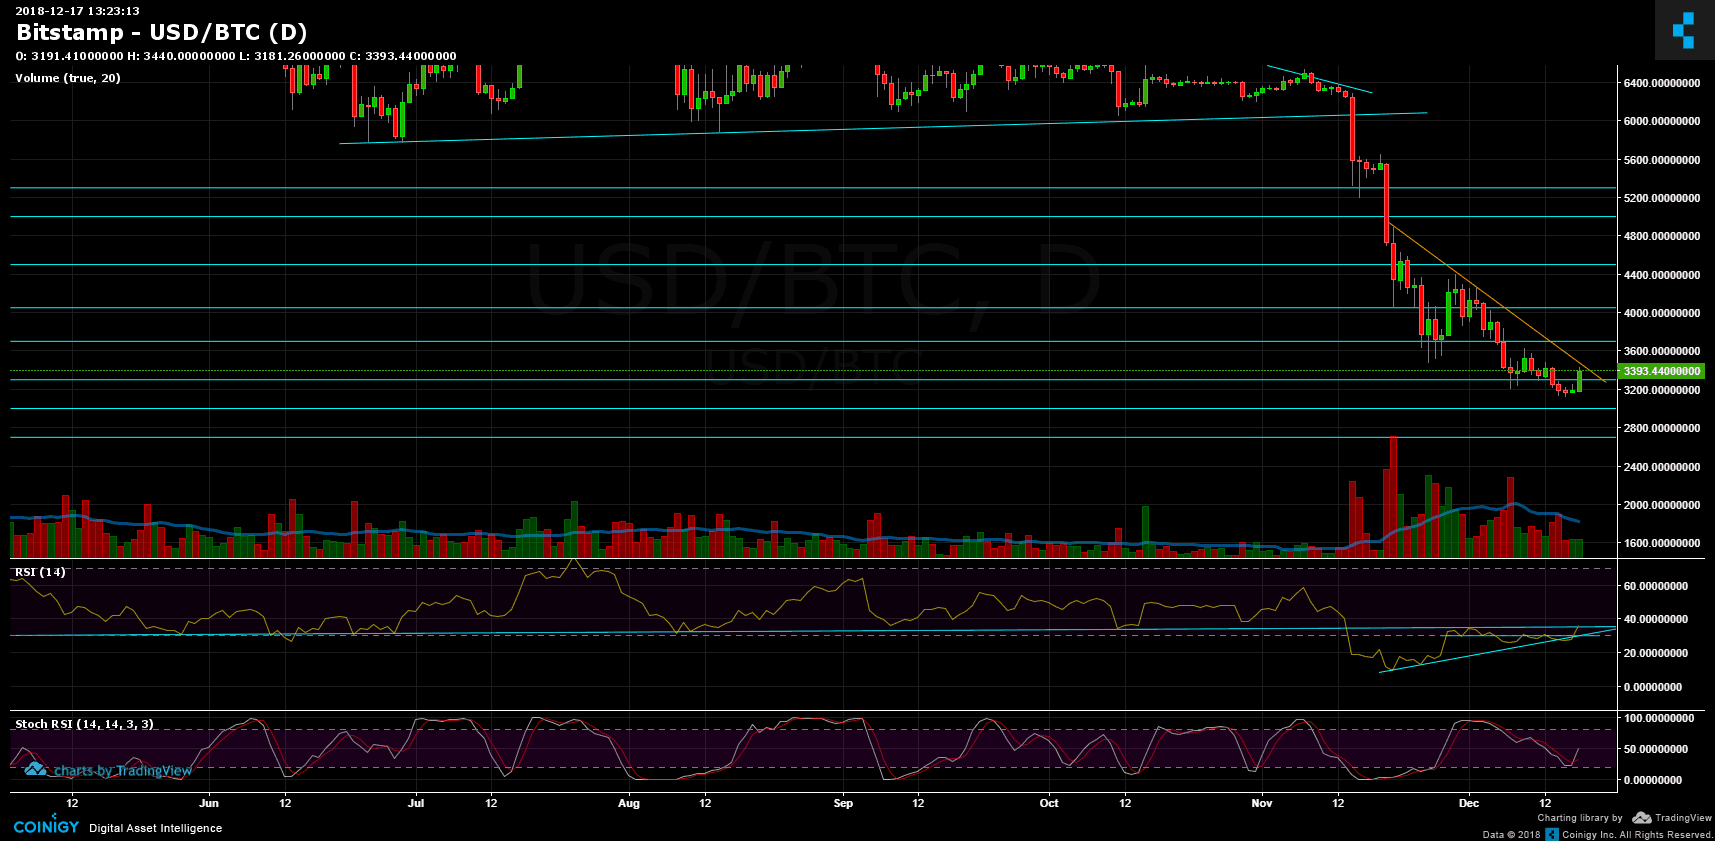
- From the bullish side, the $3450 – $3500 seems to be a strong resistance for Bitcoin: Resistance level along with a descending trend-line on the daily chart. If breaks up, the next resistance lies around $3700 (the prior high on the daily chart).
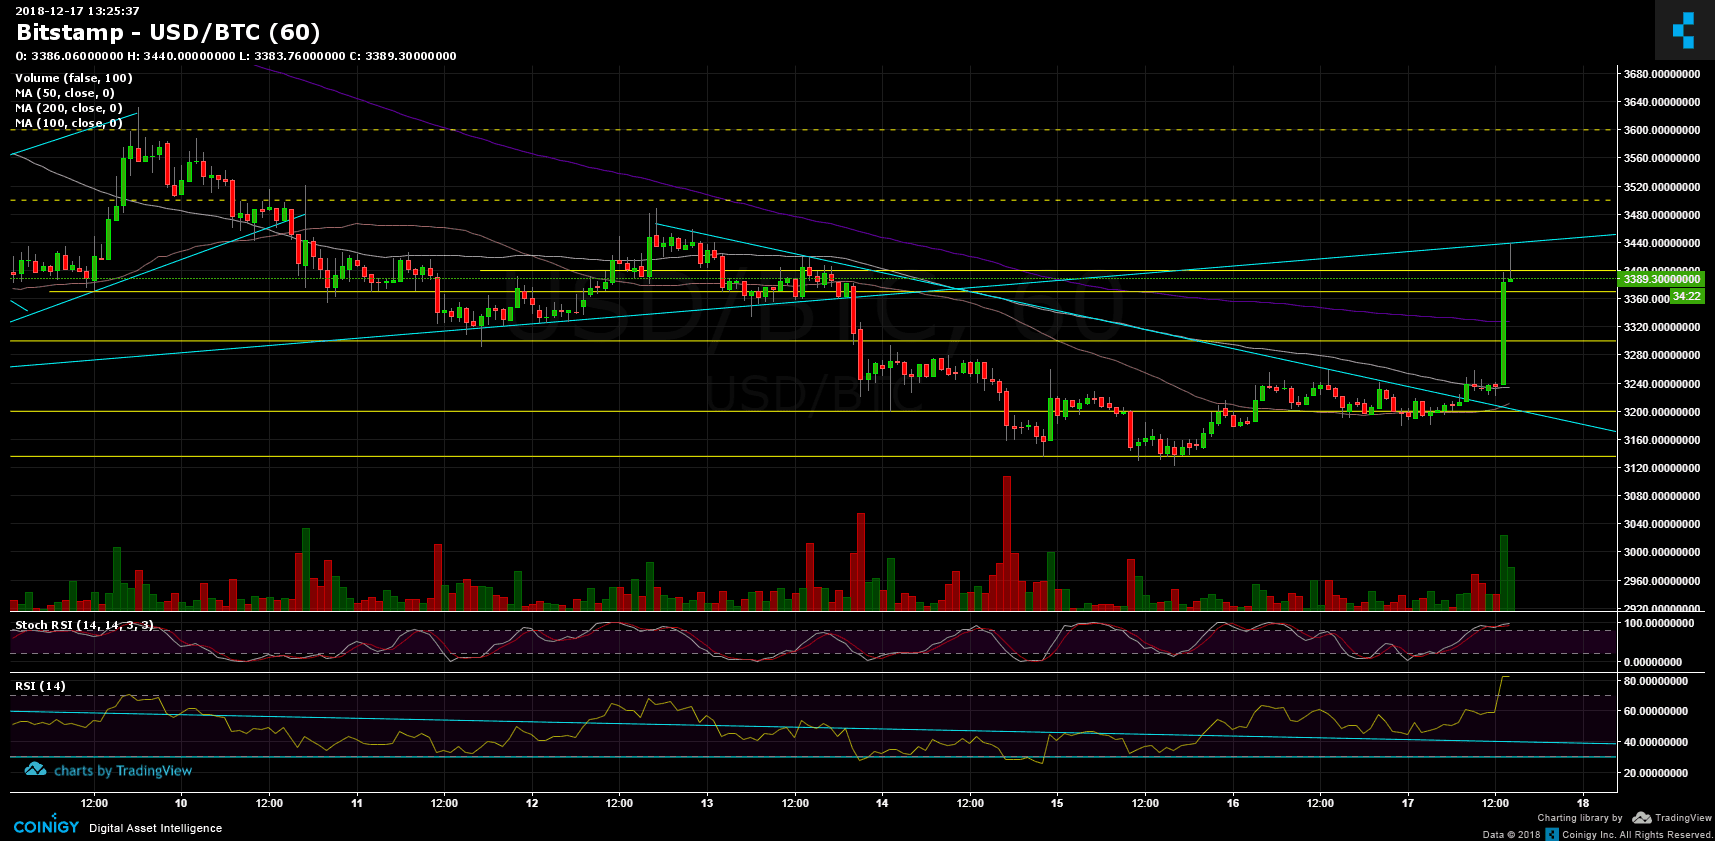
- From the bear side, after getting supported by the 100 days moving average line (~$3200, the white line on the hourly chart); Bitcoin passed $3300 (along with the 200 days moving average) and $3400. The two above levels could be tested as support in the coming up hours. Below lies the $3200 mark, and the annual low at $3120.
- Looking at the daily chart’s RSI: After breaking down the ascending trend-line three days ago, the RSI had been correcting up to re-test and break up the trend line again, breaking up also the 30 RSI level. That level was tested for three times over the last ten days. The RSI is now facing the long-term’s resistance trend line (~35). A break-up could signal of a continues bullish correction. In my opinion, the above mission won’t be so easy.
- Stochastic RSI oscillator of the daily chart is at its low (at the oversold area), and just crossed over a few hours ago. This could also signal of a coming up deeper correction to the upper side.
- The daily trading volume is still low. For a deeper positive correction, the daily volume candle needs to become much more significant.
- BitFinex’s open short positions had decreased to 39K BTC open positions.
BTC/USD BitStamp 1-Hour chart
BTC/USD BitStamp 1-Day chart
Cryptocurrency charts by TradingView. Technical analysis tools by Coinigy.
The post Bitcoin Price Analysis Dec.17: Nice $200 Breakout. Could This Start a Reversal? appeared first on CryptoPotato.