They Know The Work: Binance Coin (BNB) Climbs To a New Record Following a 20% Daily Surge
Binance Coin has continued to surge over the past 24 hours as price action rises by 20% to over $13 per coin. The market has now seen a 36% increase over the past seven days and almost doubled its value in just 30 days.
This Binance Coin price surge has primarily been attributed to the recent successful Binance Launchpad that has become active again recently with so far two fabulous fundraising of BitTorrent and Fetch.AI, and both ended in 18 minutes and 10 seconds respectively. Investors can participate in those fundraising in exchange to BNB tokens. This reminds of the Ethereum surge following the ICO season of 2017. Almost all of those ICOs were ERC-20 Ethereum blockchain based.
Besides the Launchpad, BNB is believed to be a real utility token: holding BNB grants discount on Binance trading fees.
The coin looks bullish following its new all-time high against Bitcoin, which is rare for altcoins in these days.
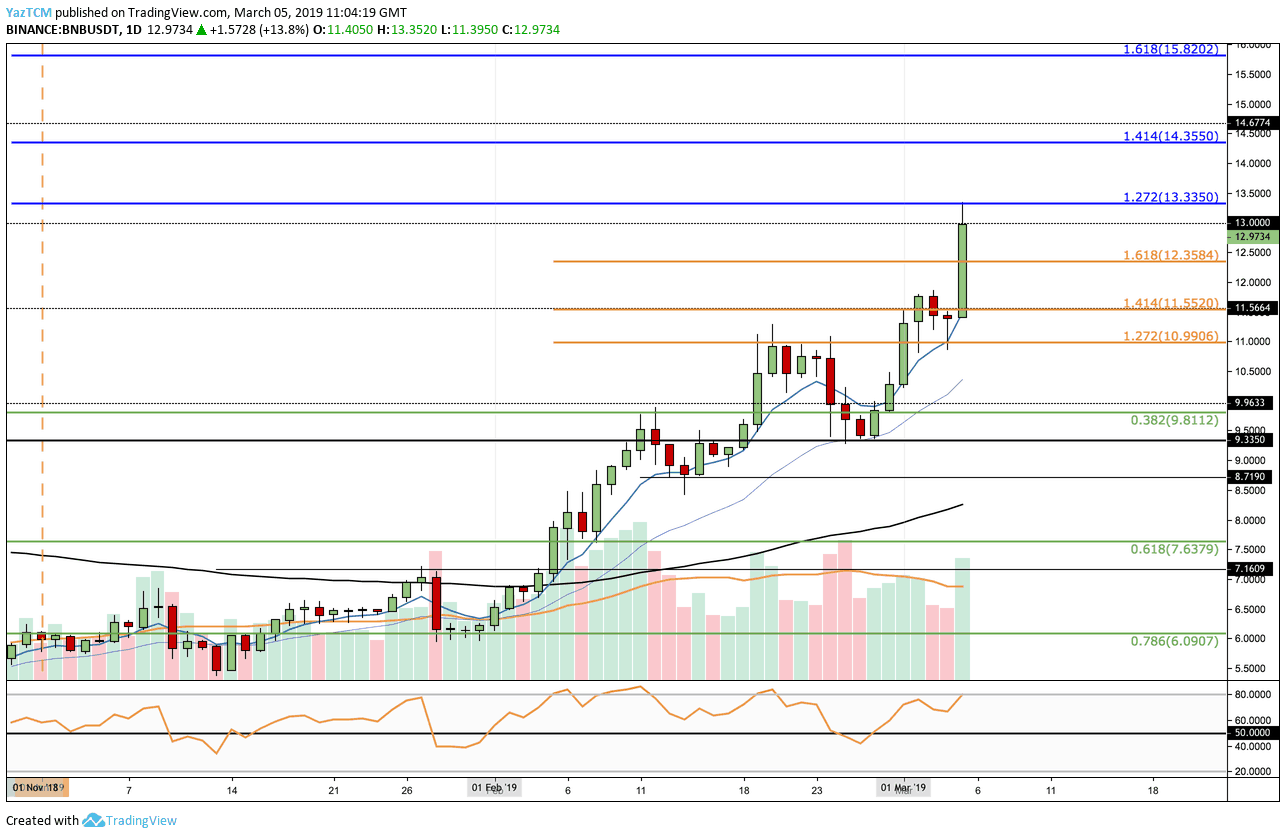
Looking at the BNB/USD 1-Day Chart:
- Binance Coin has continued to surge following our previous analysis. We can see that the market has broken beyond our mentioned resistance of $12.35 at the short term 1.618 Fibonacci Extension level (marked in orange).
- BNB has continued to rise into higher resistance of $13.35 at the medium term 1.272 Fibonacci Extension level (marked in blue). The coin is now trading around the resistance area of $13.00.
- From above: Further resistance above $13.35 lies at the 1.414 ($14.35) and 1.618 ($15.82) Fibonacci Extension levels (marked in blue).
- From below: Close by support now lies around the $12.50 level. Support beneath this can be expected at $11.52, $11 and $9.96.
- The RSI is in the bullish territory and even has some room to move higher which might indicate that the bulls are not done yet.
- The trading volume has remained consistently high during February and early March.
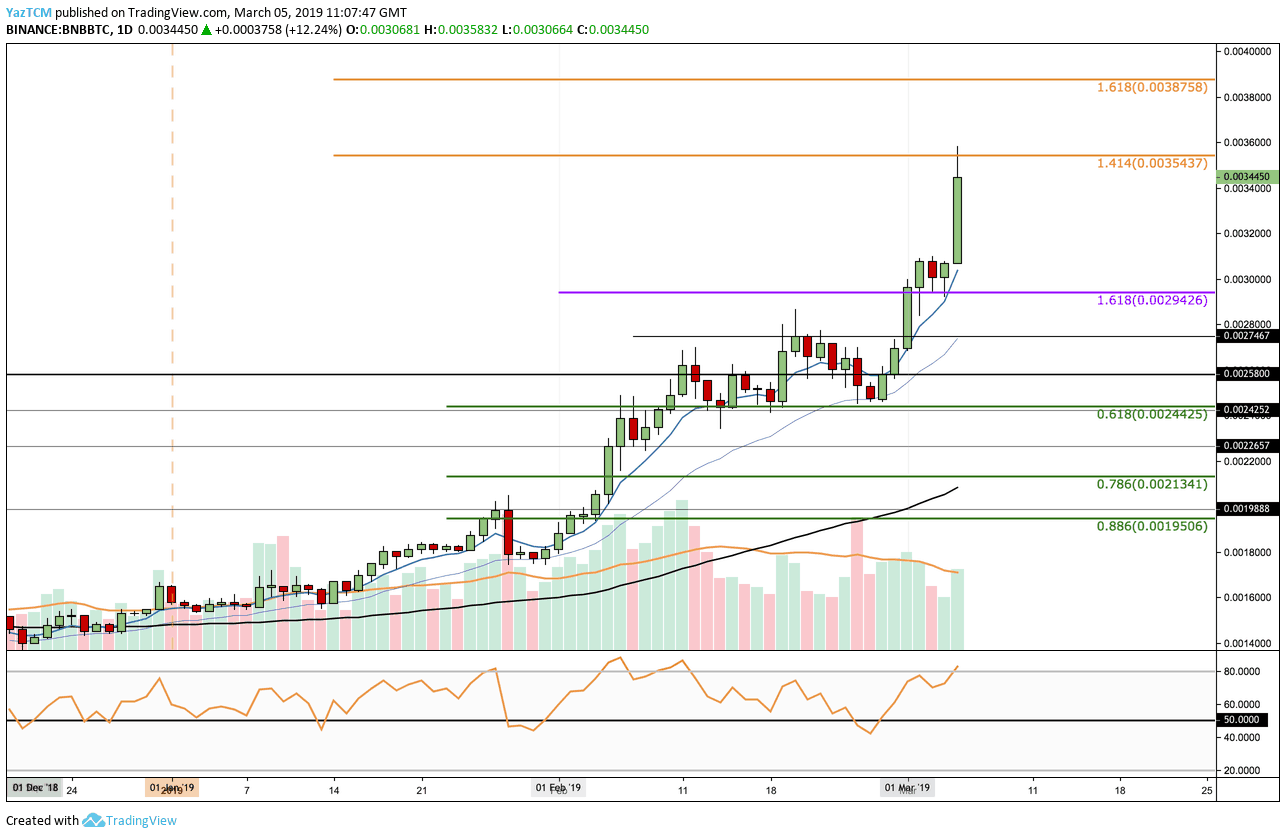
Looking at the BNB/BTC 1-Day Chart:
- BNB/BTC has also stormed above our previous resistance at 0.002942 BTC, where lies the short term 1.618 Fibonacci Extension level (marked in purple).
- Price action has continued to rise into resistance at 0.003543 BTC, where lies the medium-termed 1.414 Fibonacci Extension level (marked in orange). Further resistance lies at 0.0036 BTC and 0.0038 BTC and at 0.003875 BTC, where lies at the 1.618 Fibonacci Extension level (marked in orange).
- From below: The closest support lies at 0.0034 BTC, 0.0032 BTC, and 0.0030 BTC. Further support beneath is located at 0.002746 BTC and 0.002580 BTC.
- The RSI is in bullish territory as buyers dominate market momentum.
- The trading volume has also remained consistently high.
The post They Know The Work: Binance Coin (BNB) Climbs To a New Record Following a 20% Daily Surge appeared first on CryptoPotato.