Ripple Price Analysis May 9: XRP Lost 50% In 4-Month Against Bitcoin. Where Is The Floor?
Bitcoin is breaking 2019 high surpassing $6000, and the altcoins are suffering: Ripple continues to struggle as XRP tumbles into support around the $0.30 level. The cryptocurrency has seen a 15% price drop over the past 30 trading days alone. Against Bitcoin, the situation for XRP is a lot worse.
XRP/BTC has been falling consistently throughout the year, dropping nearly 50% from the yearly open price. Yesterday the coin dropped below the support at the 5000 SAT level.
Ripple is still ranked on the third place as the top projects by market cap value as it currently holds a $12.57 billion market cap value.
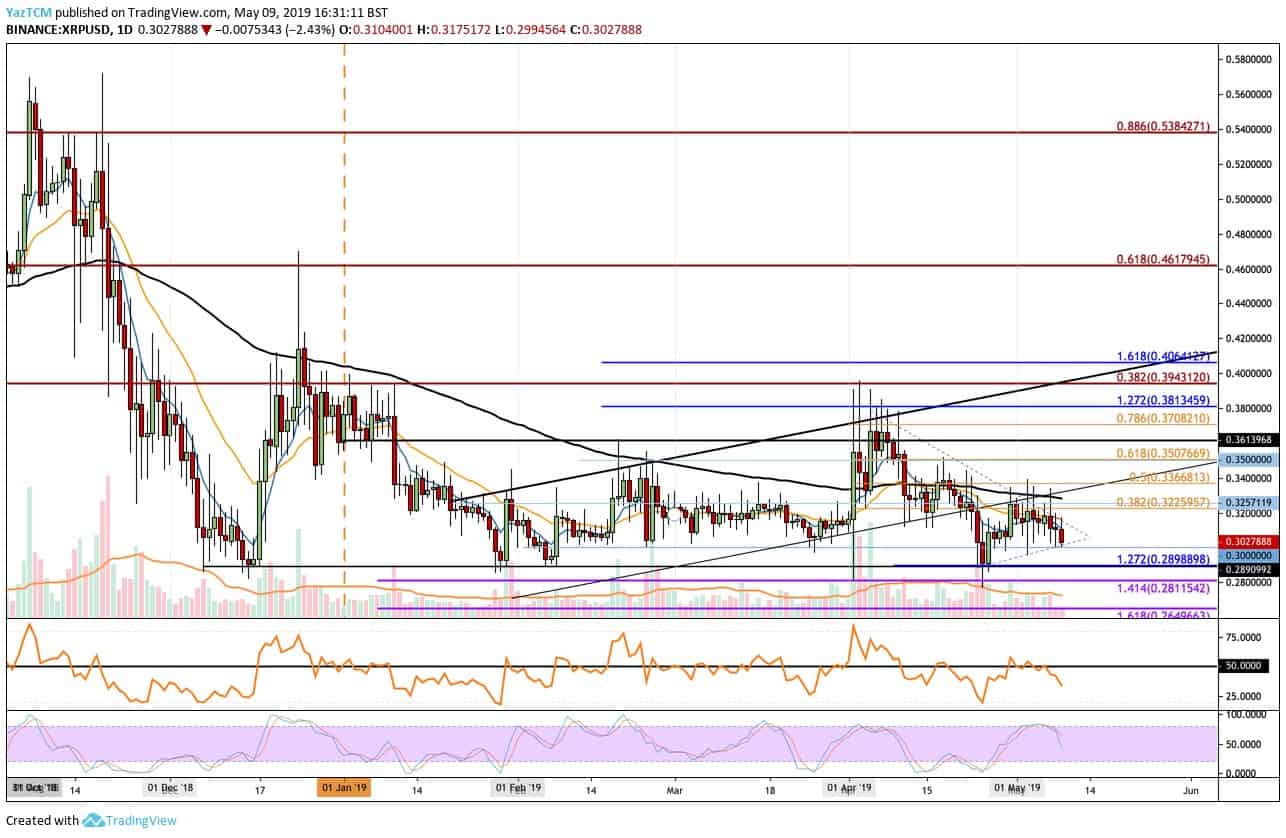
Looking at the XRP/USD 1-Day Chart:
- Since our last XRP analysis, we can see that XRP/USD has fallen further lower into the support at the $0.30 level. If the coin continues lower from here, the price will fall beneath a short-term wedge we have been following on our recent analysis.
- From above: The nearest level of resistance now lies at $0.31 and $0.32. Further resistance lies at $0.336 which contains the short term bearish .5 Fibonacci Retracement level (marked in orange). Above $0.3366, further resistance lies at $0.3507, $0.3615 and $0.3708.
- From below: The nearest level of support beneath $0.30 lies at $0.29. This area is had provided strong support for the XRP market between December 2018 and February 2019. Therefore expected to provide strong support moving forward. Beneath $0.29, further support is located at $0.2811 and $0.2650.
- The Stochastic RSI had recently initiated a crossover signal in the overbought territory which led to the price falling following the signal. The RSI has now entered into a bearish territory below 50 as the sellers take control of the market momentum.
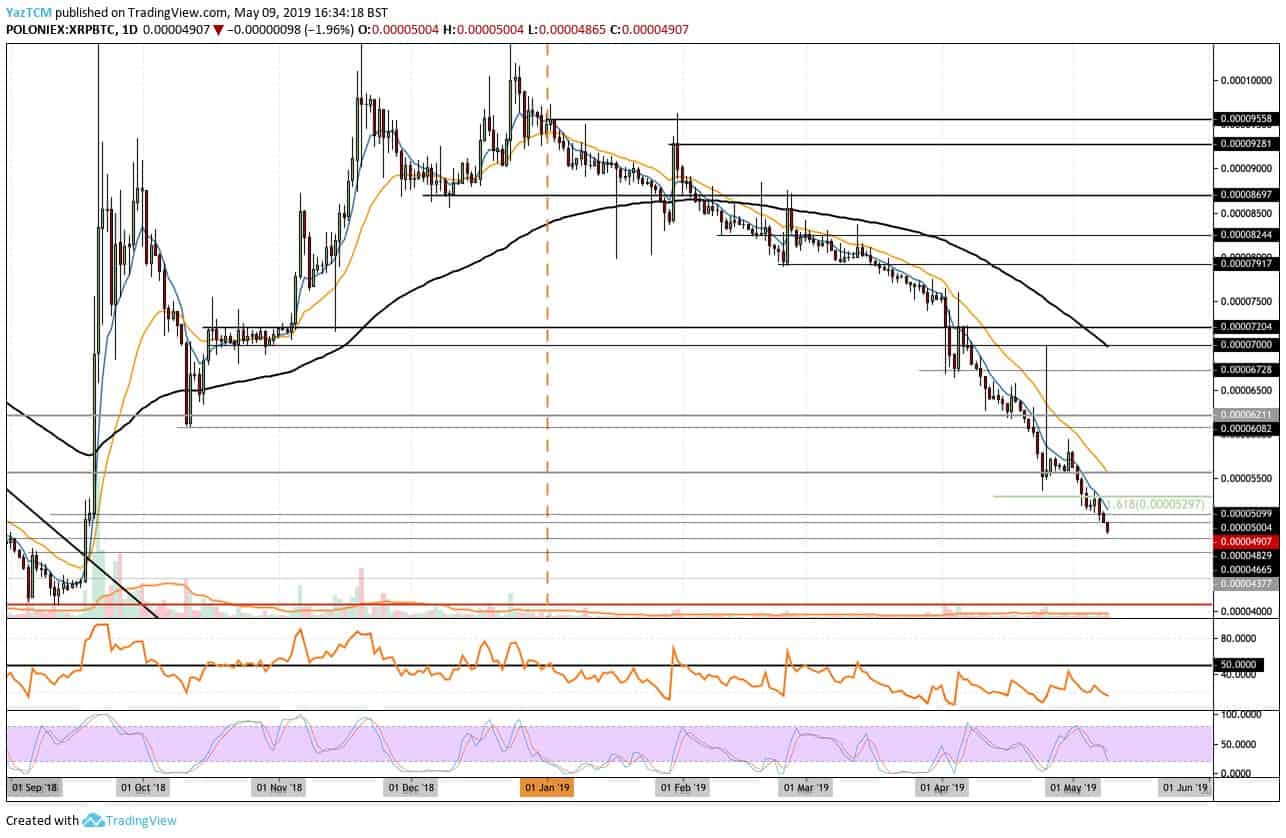
Looking at the XRP/BTC 1-Day Chart:
- Against Bitcoin, we can see Ripple has also dropped below the support at 5000 SAT and continued lower to where it is currently trading around 4907 SAT. The coin has been dropping all year long against Bitcoin and over the past month, had lost 30% alone.
- From above: The nearest level of resistance above now lies at 5000 SAT. Further resistance (support turned resistance) lies at 5100 SAT, 5300 SAT and 5500 SAT. Higher resistance is located at 7000 SAT (which contains the 100-days moving average line) and 7200 SAT.
- From below: The nearest level of support now lies at 4800 SAT. If the bears continue lower, then further support lies at 4650 SAT and 4380 SAT.
- The RSI continues to remain within the favor of the bears’ momentum, as it has done throughout the entire year. For recovery, we will need to see the RSI break above the 50 level.
The post Ripple Price Analysis May 9: XRP Lost 50% In 4-Month Against Bitcoin. Where Is The Floor? appeared first on CryptoPotato.