These Two Critical Levels Will Determine BTC’s Mid-Term Trajectory: Bitcoin Price Analysis
Following an extended sideways consolidation phase, Bitcoin underwent a downtrend, touching the significant support zone around $60K. However, expectations point towards a resurgence in buying pressure, potentially leading to a rebound.
Technical Analysis
By Shayan
The Daily Chart
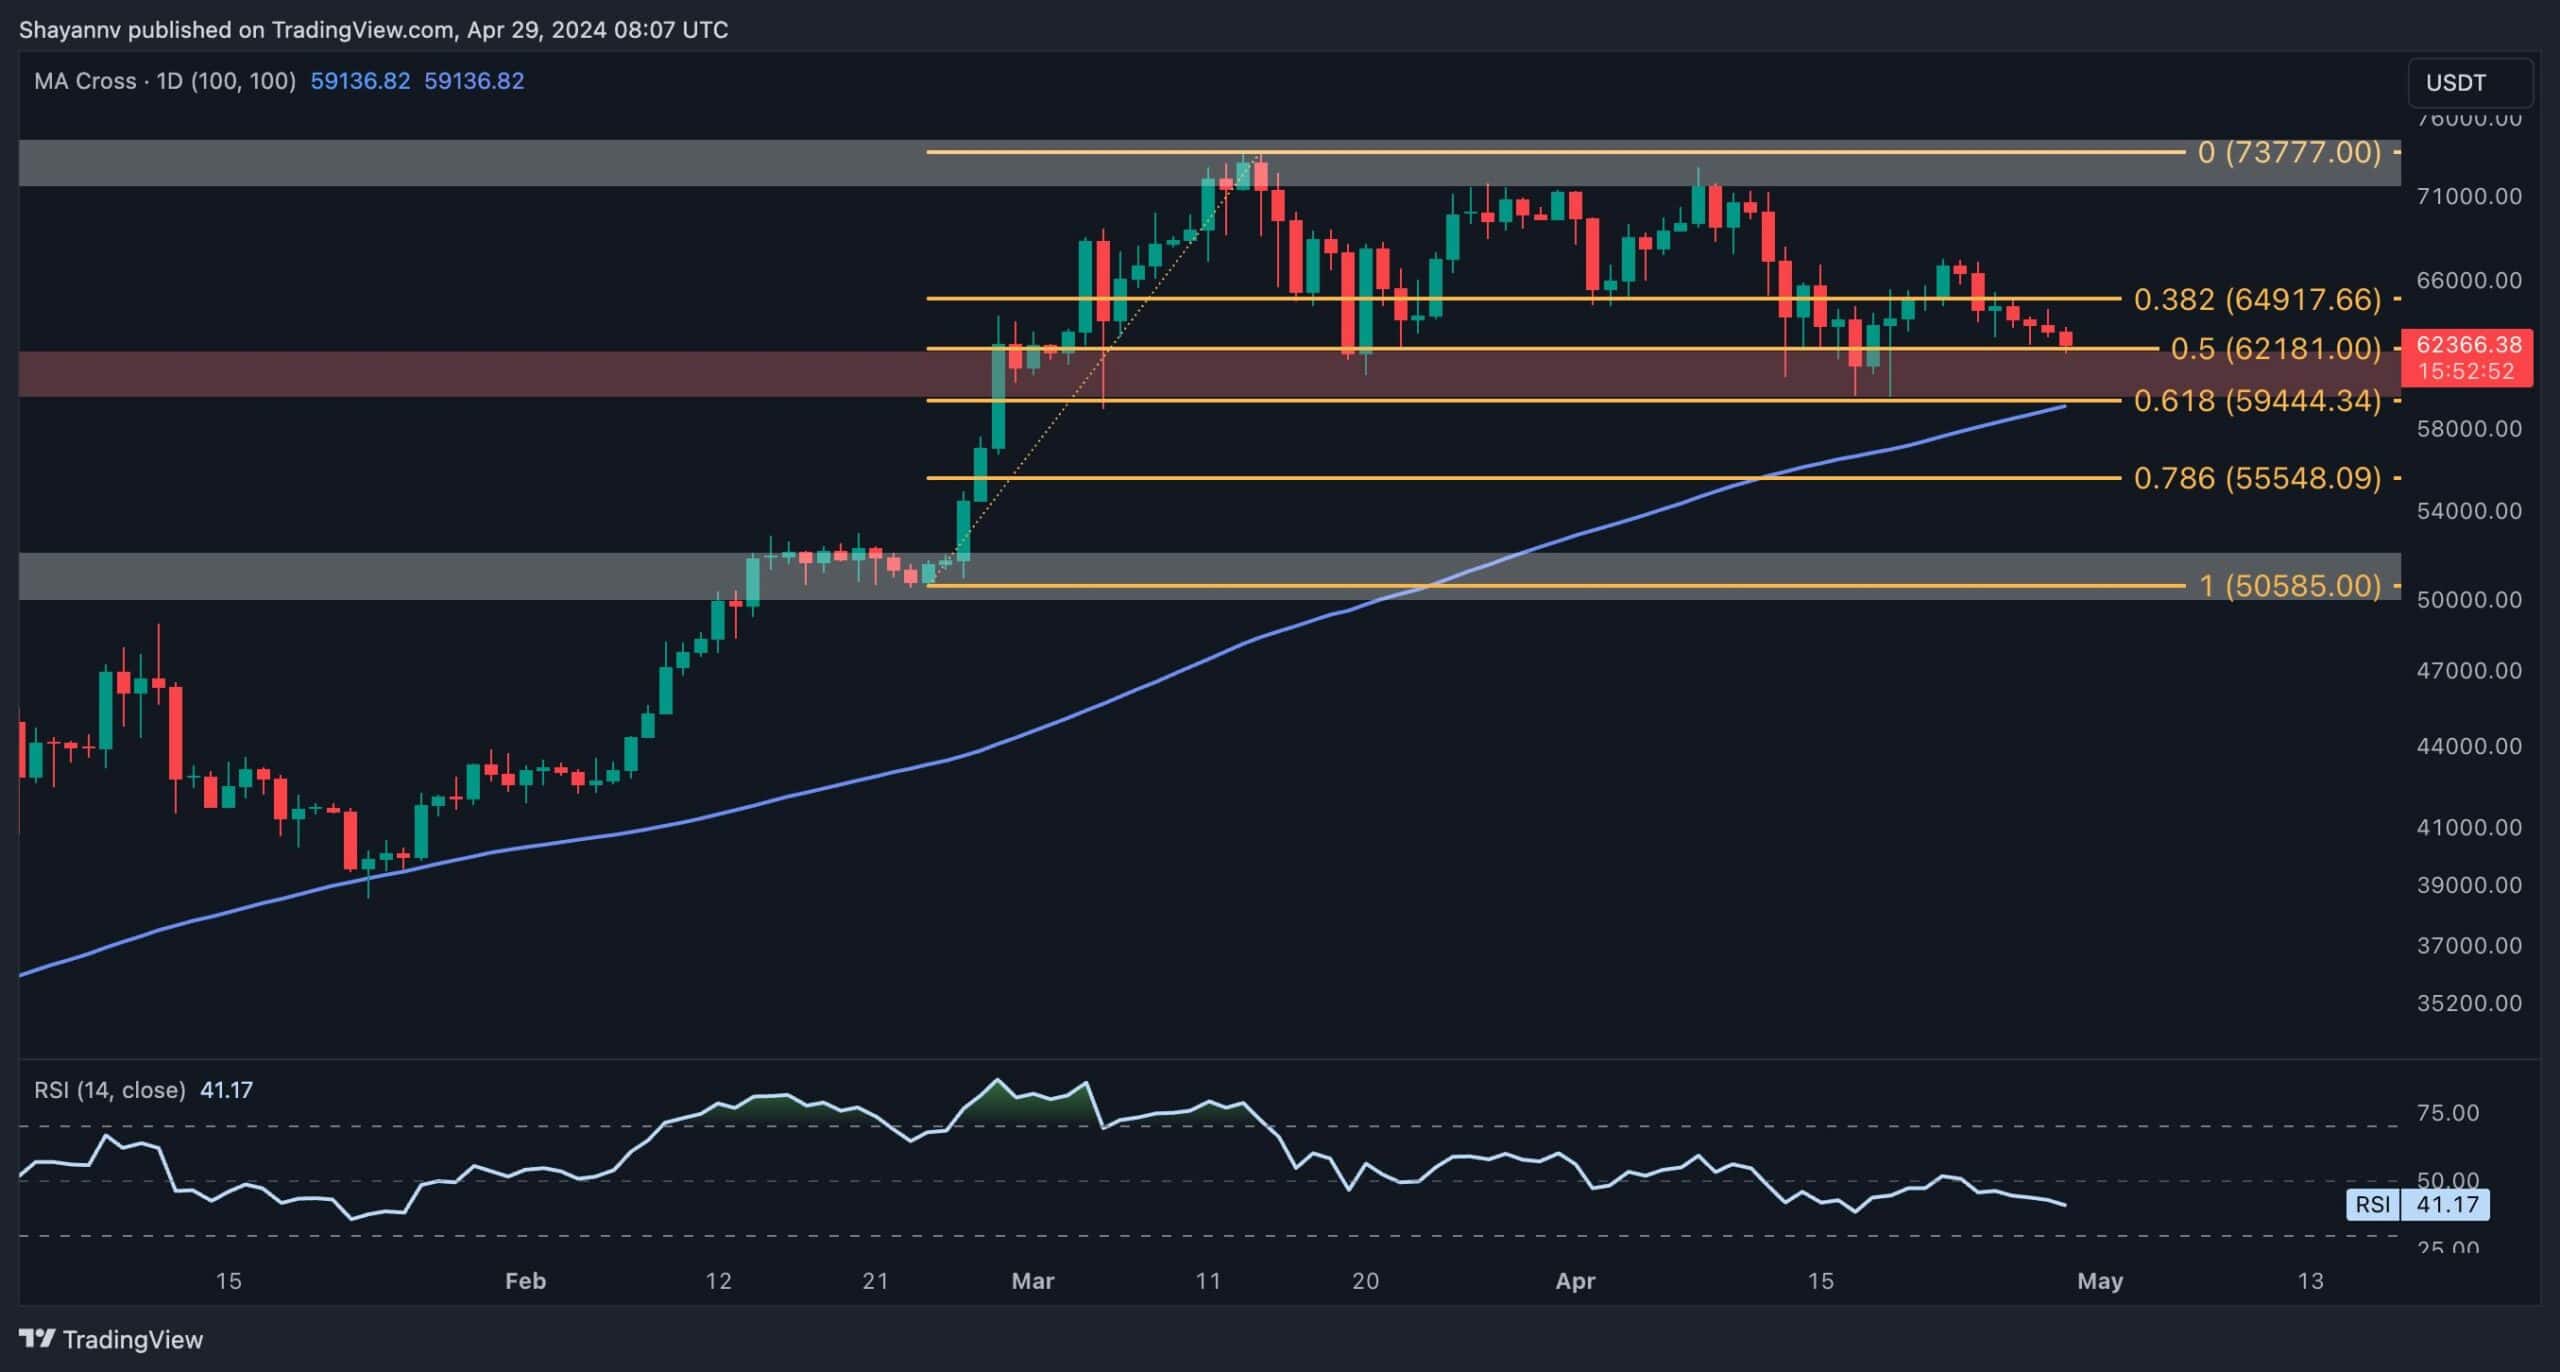
A comprehensive review of the daily chart unveils an extended period of sideways consolidation within the pivotal price range of $60K to $72K, with the recent price action seeing a decline towards the lower boundary of this range.
Currently, Bitcoin finds itself at a crucial support zone, spanning between the 0.5 ($62,181) and 0.618 ($59,444) Fibonacci retracement levels, in alignment with the vital 100-day moving average at $59K.
This support region holds significant importance and could trigger a bullish reversal in the short term. However, a sudden and unexpected breach below this critical level could catalyze a long-squeeze event, leading to a notable downward movement.
The 4-Hour Chart
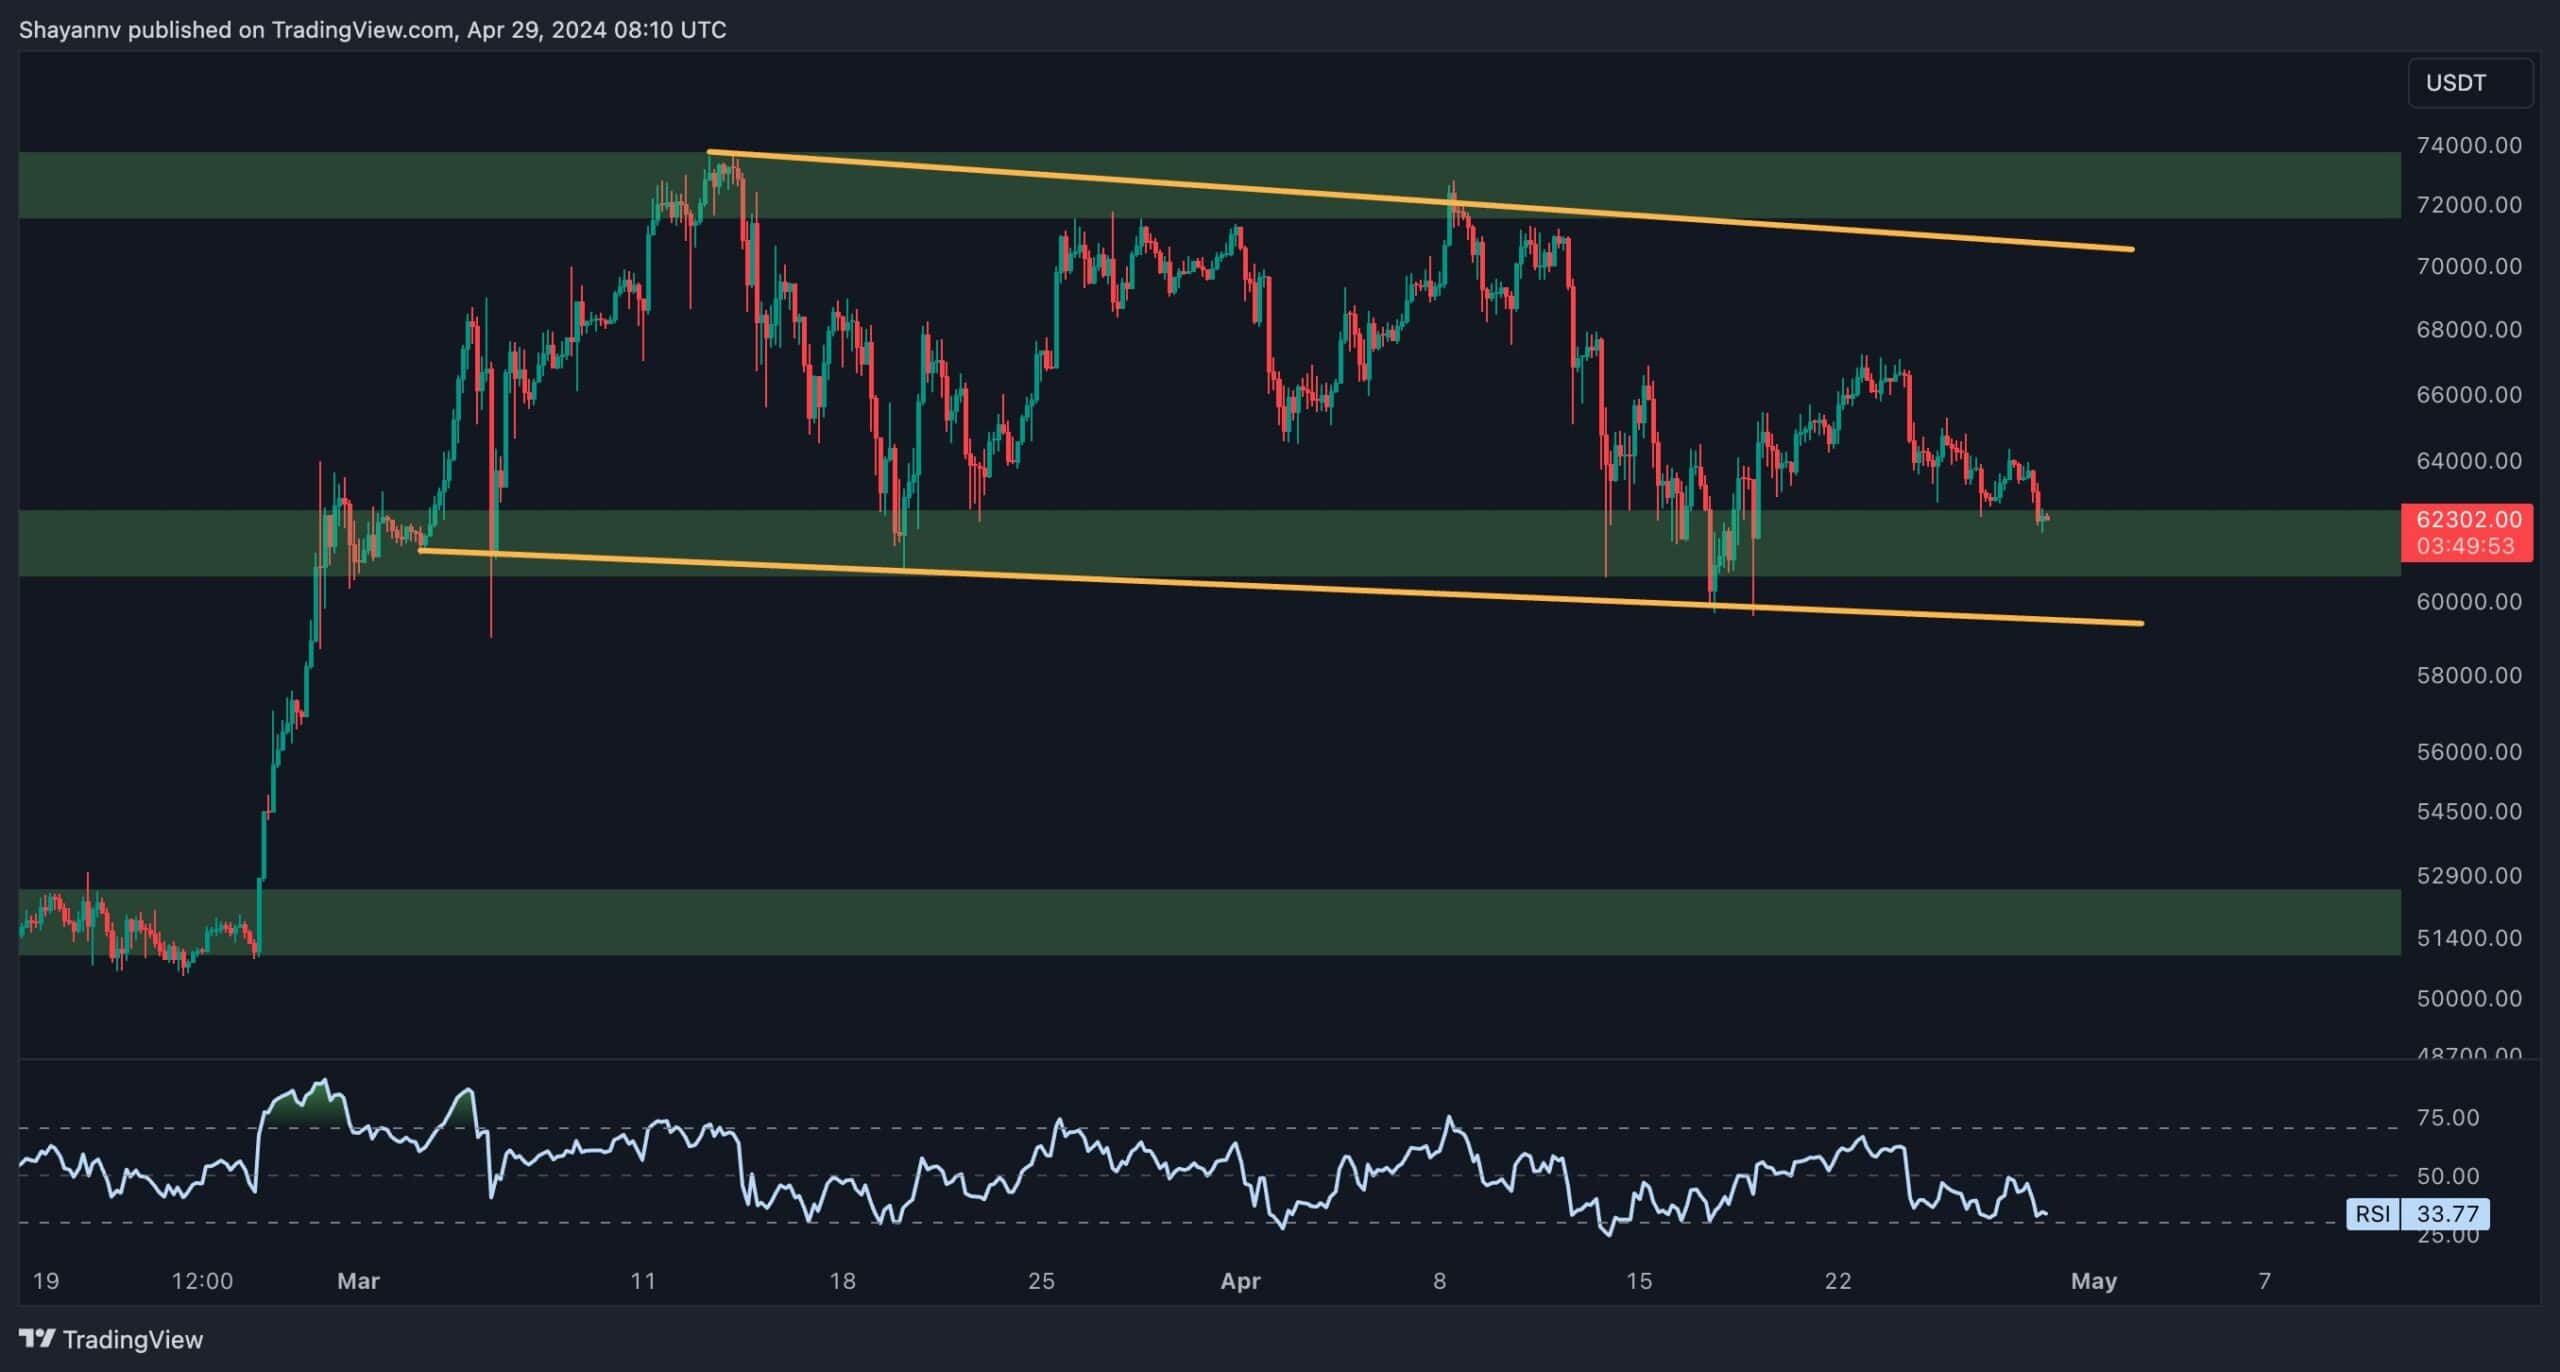
Analyzing the 4-hour chart reveals heightened selling pressure following Bitcoin’s inability to reclaim the upper boundary of the descending wedge. This resulted in a noticeable downtrend towards the lower trendline of the wedge, hovering around $60K.
Upon reaching this crucial level, the selling pressure encountered sufficient demand, leading to a minor consolidation phase. However, sellers remain intent on breaching the lower boundary of the wedge.
If buyers regain control and the price finds support around this critical level, a bullish rebound toward the previous major swing high of $68K could unfold. Nonetheless, the $60K mark currently stands as the primary reference point for Bitcoin, with price action around it likely dictating the cryptocurrency’s near-term trajectory.
On-chain Analysis
By Shayan
Bitcoin continues to endure a prolonged consolidation phase, with the price approaching the $60K threshold. Given this scenario, delving into sentiment analysis within the futures market can offer valuable insights into its potential trajectory.
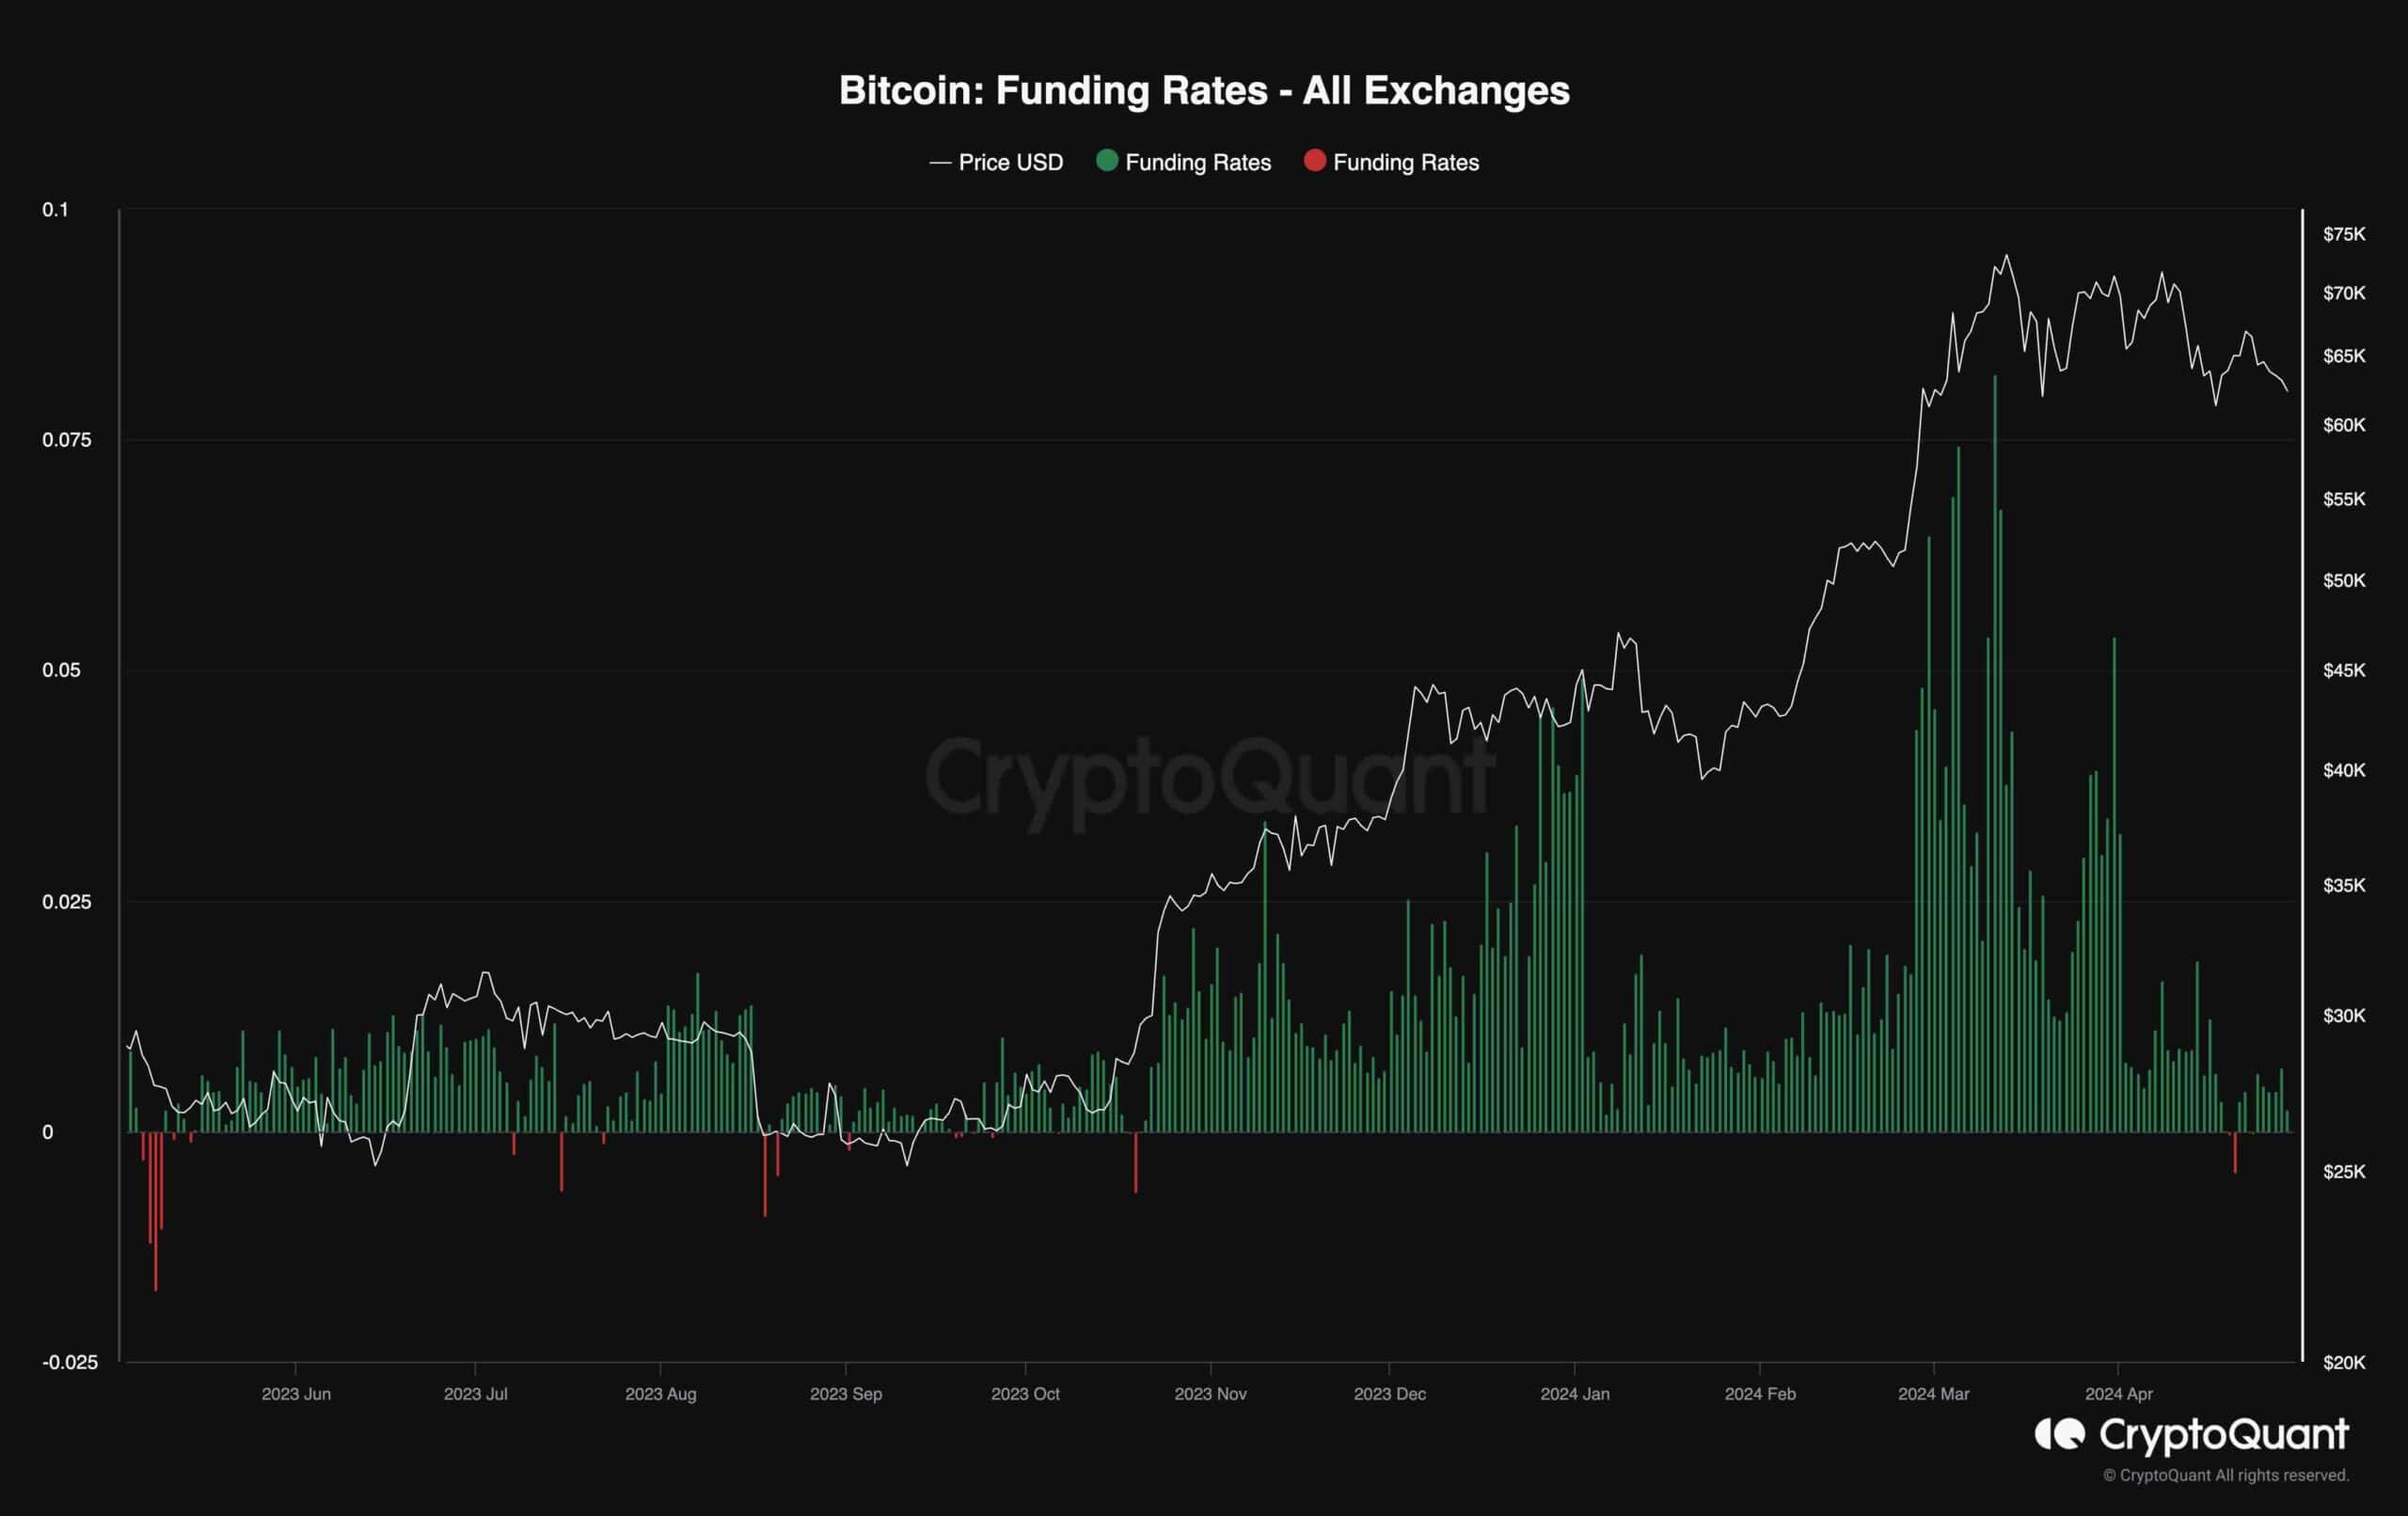
The chart provided offers a glimpse into funding rates, a pivotal metric that gauges the dominance of buyers or sellers in driving market dynamics. Upon examination, recent corrective retracements have prompted a significant downturn in funding rates, approaching levels near zero.
This downturn signifies a favorable development over the long term, as it alleviates the pressure for further liquidations and lays the groundwork for the resurgence of both long and short positions in the perpetual market. Consequently, the market appears primed to embark on a renewed impulsive trend, marking an end to the prevailing phase of uncertainty and sideways consolidation.
The post These Two Critical Levels Will Determine BTC’s Mid-Term Trajectory: Bitcoin Price Analysis appeared first on CryptoPotato.