Ripple Finally Joins Altcoin Season 2019 With Daily 15% Gains: XRP Price Analysis April 5
Ripple has seen a price surge against the USD over the past 24 hours which totals 6% as of now, after recording 15% earlier today, bringing the current trading price for the coin up to around $0.37. Although the XRP market has been suffering against Bitcoin, the recent Bitcoin price surge has now sums-up 17% weekly rise of Ripple against Bitcoin.
Ripple is ranked in 3rd place on the top cryptocurrencies by market-cap as it holds $15.07 billion market cap value.
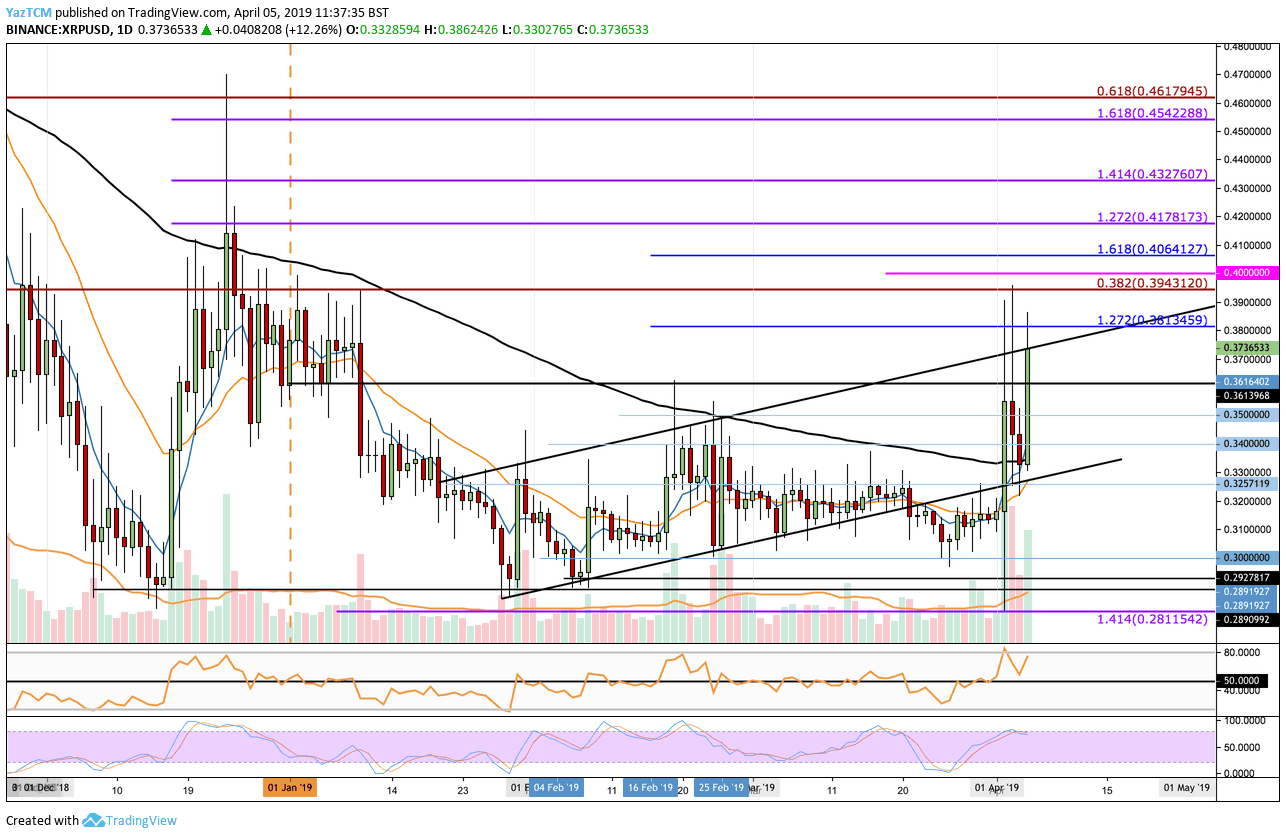
Looking at the XRP/USD 1-Day Chart:
- Ripple has gone through a roller-coaster /since our previous XRP/USD analysis. The market had managed to hold the support at the $0.30 level, except for a brief glitch lower toward $0.28 on April 2nd. We can see that the coin has now surged back into the boundaries of the ascending price channel and has met resistance at the upper border one more time. The recent price increase broke up above the 100-day moving average line.
- From above: if the buyers can push the market above the ascending price channel, the nearest resistance lies at $0.40 which contains a long term bearish .382 Fibonacci retracement level. Above this, we can expect higher resistance at $0.4180, $0.4330 and at $0.4620 where lies the bearish .618 Fibonacci retracement level.
- From below: Initial support now lies at $0.3615 and $0.35. If the sellers continue beneath, further support lies at $0.34 and the lower boundary of the ascending price channel. Beneath the channel, support lies at $0.32 and $0.30.
- Stochastic RSI oscillator is about to cross over at the overbought area which shows that the market is overstretched once again.
- The trading volume has increased significantly during the opening of April 2019.
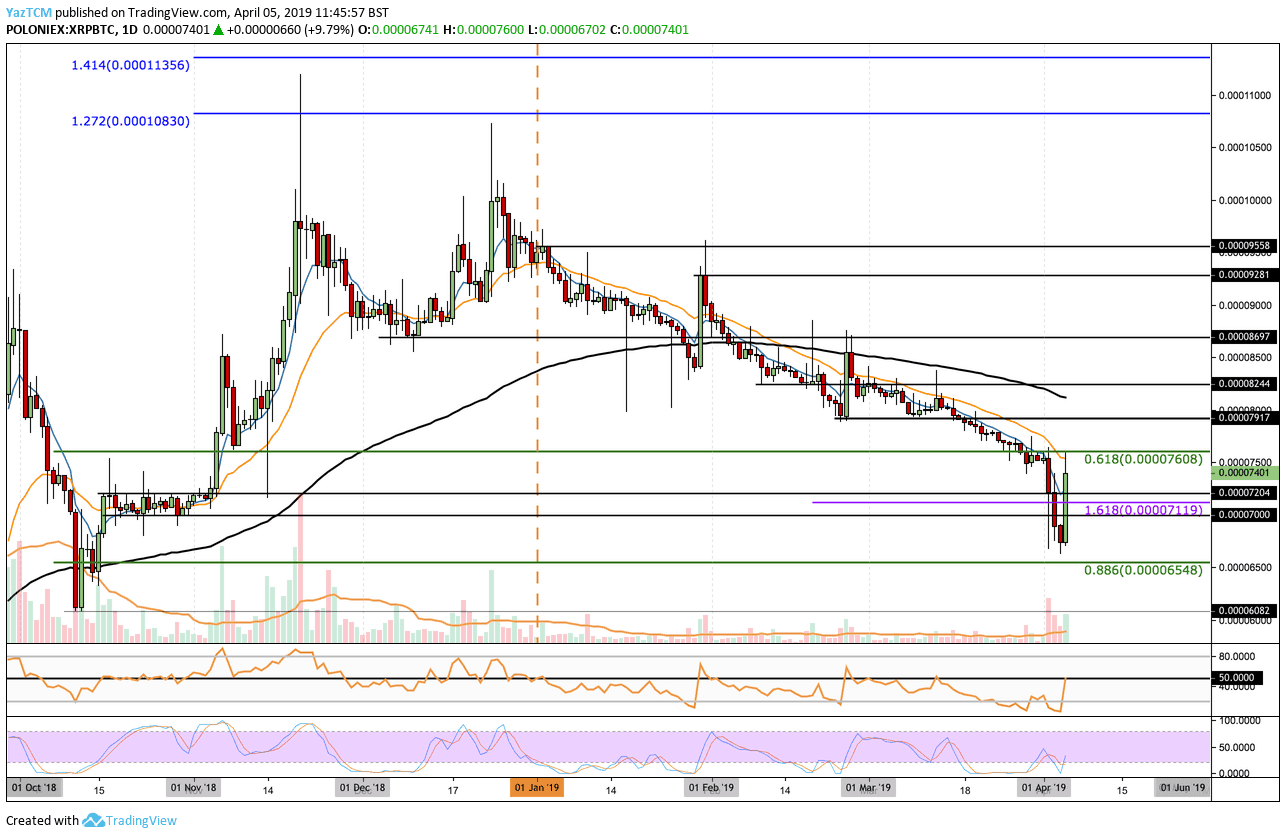
Looking at the XRP/BTC 1 Day Chart:
- Against Bitcoin, we can see that Ripple had traveled further beneath our expected support at 7119 SAT toward 6600 SAT where support was found. The market has now rebounded and encountered resistance at 7600 SAT (daily high) where lies the .618 Fibonacci retracement level.
- From above: In case of breaking up 7600 SAT, the nearest level of resistance lies at 8000 SAT where also lies the 100-day moving average line. Above this, more resistance is located at 8250 SAT, 8700 SAT and 9000 SAT.
- From below: The nearest level of support is located at 7200 SAT and 7000 SAT. Beneath 7000 SAT, further support is located at 6600 SAT and 6000 SAT.
- The stochastic RSI oscillator has recently initiated a cross over above which signals that XRP/BTC may see correction up over the next few days.
The post Ripple Finally Joins Altcoin Season 2019 With Daily 15% Gains: XRP Price Analysis April 5 appeared first on CryptoPotato.