Bitcoin Price Analysis April.5: Can The Bulls Maintain The Positive Sentiment Around $5000?
Following our previous Bitcoin price analysis, we can see that Bitcoin had broken up the $5100 resistance and quickly regained position to our mentioned target at $5300 area.
After completing the above target, we saw Bitcoin rapidly dropping 10%, which is very reasonable following the $1100 bullish move. As of now, Bitcoin is struggling with the tough resistance of the $5000 level.
Total Market Cap: $174.45 Billion
Bitcoin Market Cap: $87.7 Billion
BTC Dominance: 50.3%
Looking at the 1-day & 4-hour charts
– Support/Resistance:
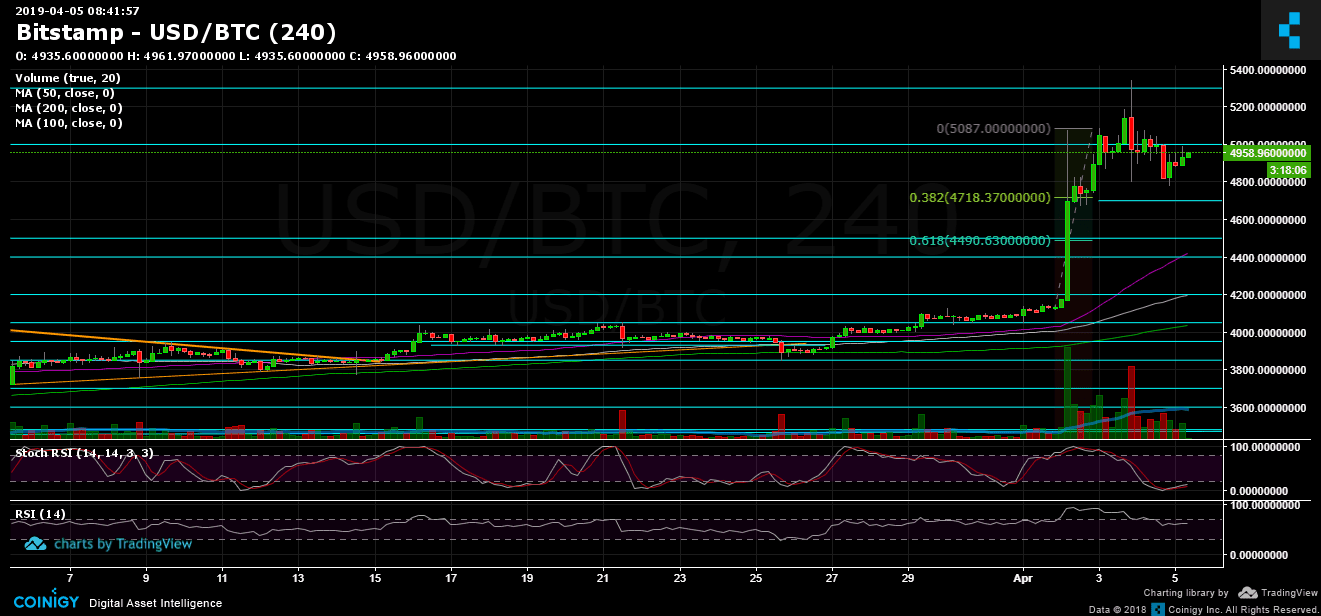
From above, Bitcoin is still facing the $5000 area. The bears had set there high supply levels and it seems that the task won’t be so easy. As mentioned in our previous analysis, the next significant resistance area of $5300, further resistance (weak) lies at $5500 before reaching the 2018 legendary support turned resistance line at $5700.
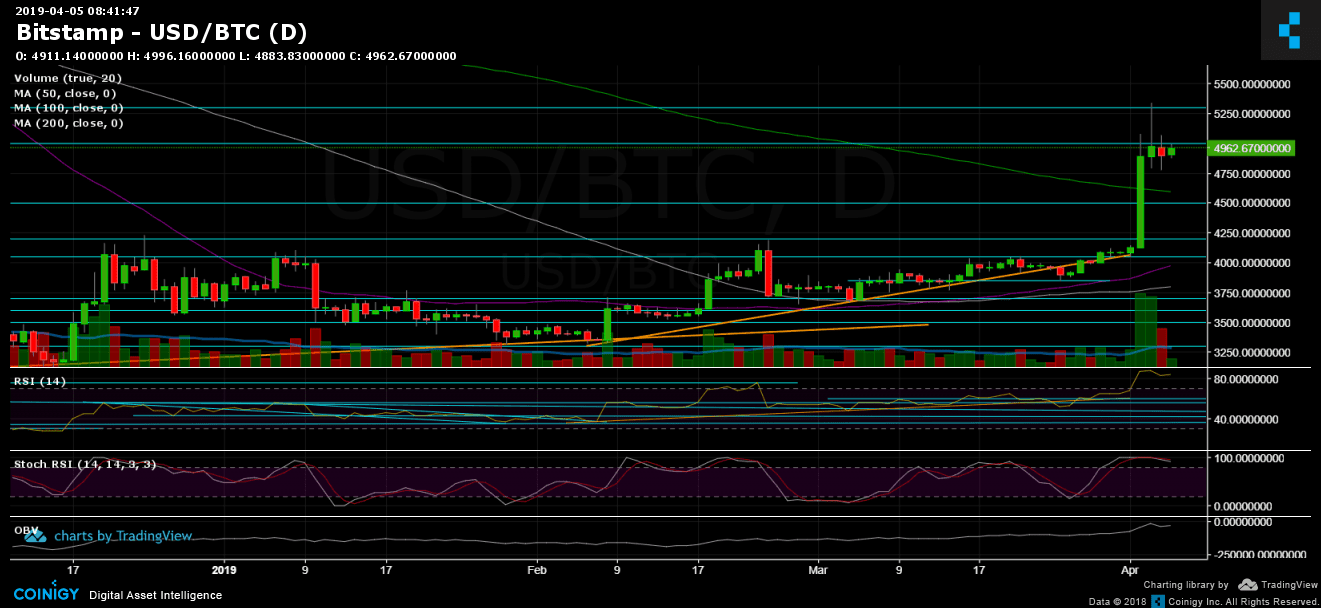
From below, there is strong support around $4700 (38.2% Fibonacci retracement level) and even stronger support around $4600, where lies the 200-days moving average line of the daily chart (marked in light green). It’s likely to see the strong daily MA-200 getting retested again – Whether it will be soon, around $4600-4700 or in the next couple of weeks. Below lies resistance turned support levels of $4500 (61.8% Fibonacci retracement level) and $4400.
– Daily chart’s RSI: Stochastic RSI oscillator is stretched out and could be crossing down soon in the overbought area. This could signal on a coming up correction to retest prior support levels.
– The daily trading volume: The recent Bitcoin FOMO was followed by massive amount of volume during Tuesday and Wednesday. Yesterday’s sellers’ volume candle was a lot smaller, which is how a bull market needs to look like (high green candles vs. short red candles). Monitoring the volume in the next days will be interesting.
– BitFinex open short positions: There was not much of a change in this field, as the open short positions stand around 20.8K of BTC open positions.
BTC/USD BitStamp 4-Hour Chart
BTC/USD BitStamp 1-Day Chart
The post Bitcoin Price Analysis April.5: Can The Bulls Maintain The Positive Sentiment Around $5000? appeared first on CryptoPotato.