Polkadot Price Analysis: DOT Spikes 8%, Heading Towards Crucial Resistance
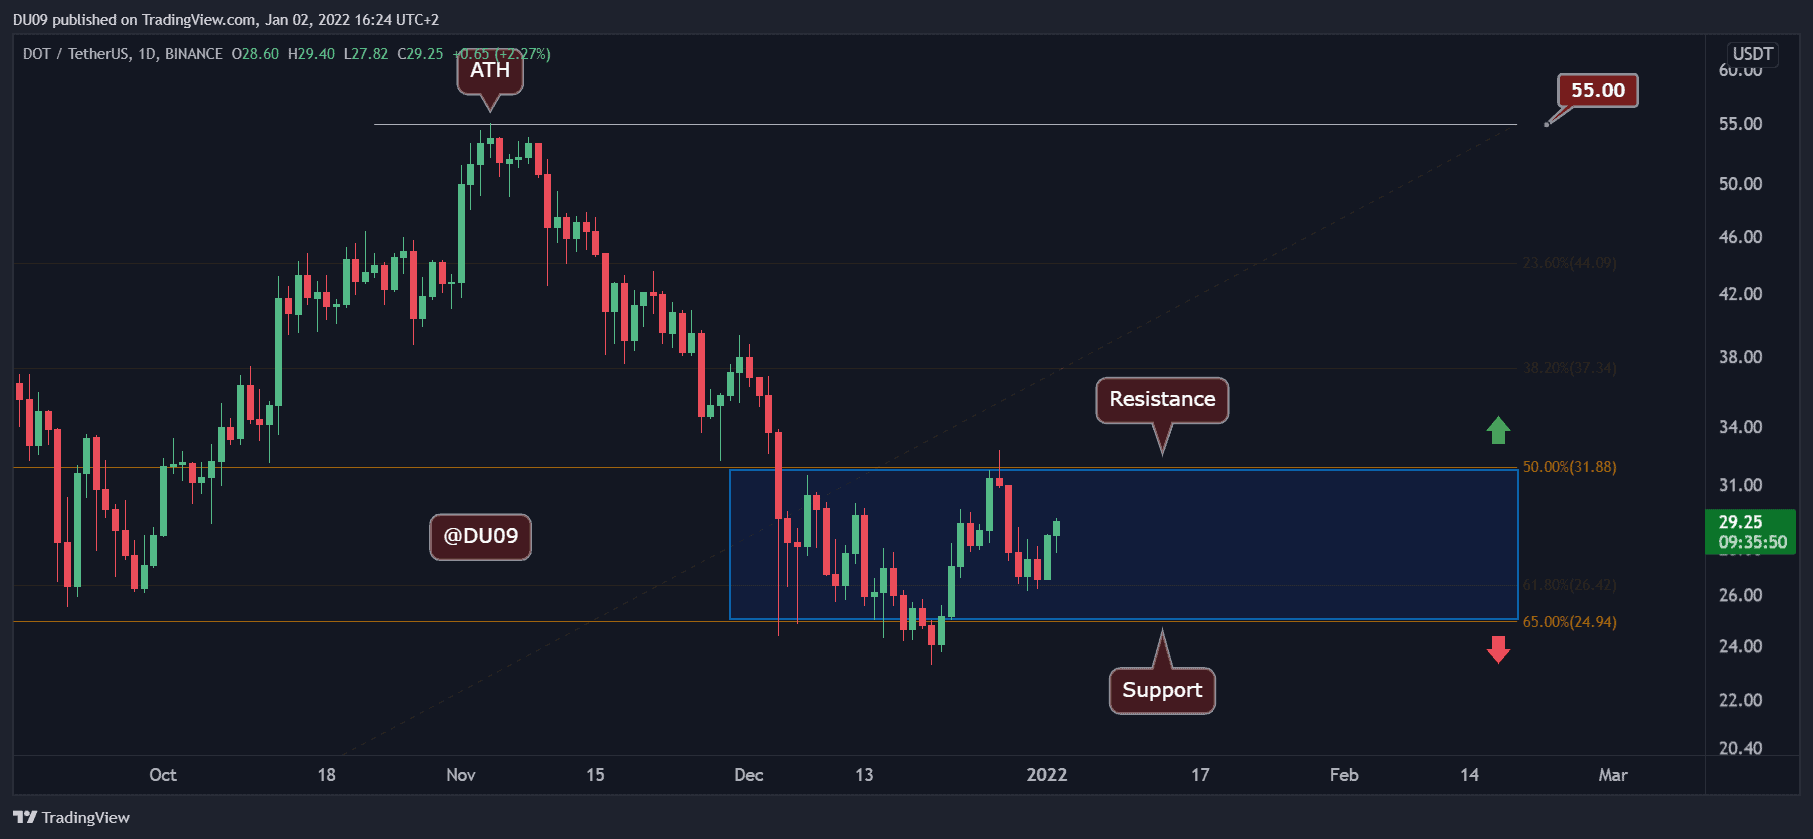
Following an 8% daily increase, DOT attempts to retest the key resistance at $32 on renewed momentum.
Key Support level: $25
Key Resistance level: $32
Polkadot’s DOT native token completed a short-term correction and is now creating a support floor and trading range between the support level at $25 and resistance at $32.
The first attempt to break out above this trading area was rejected last Monday. However, DOT appears ready for a second tryout.
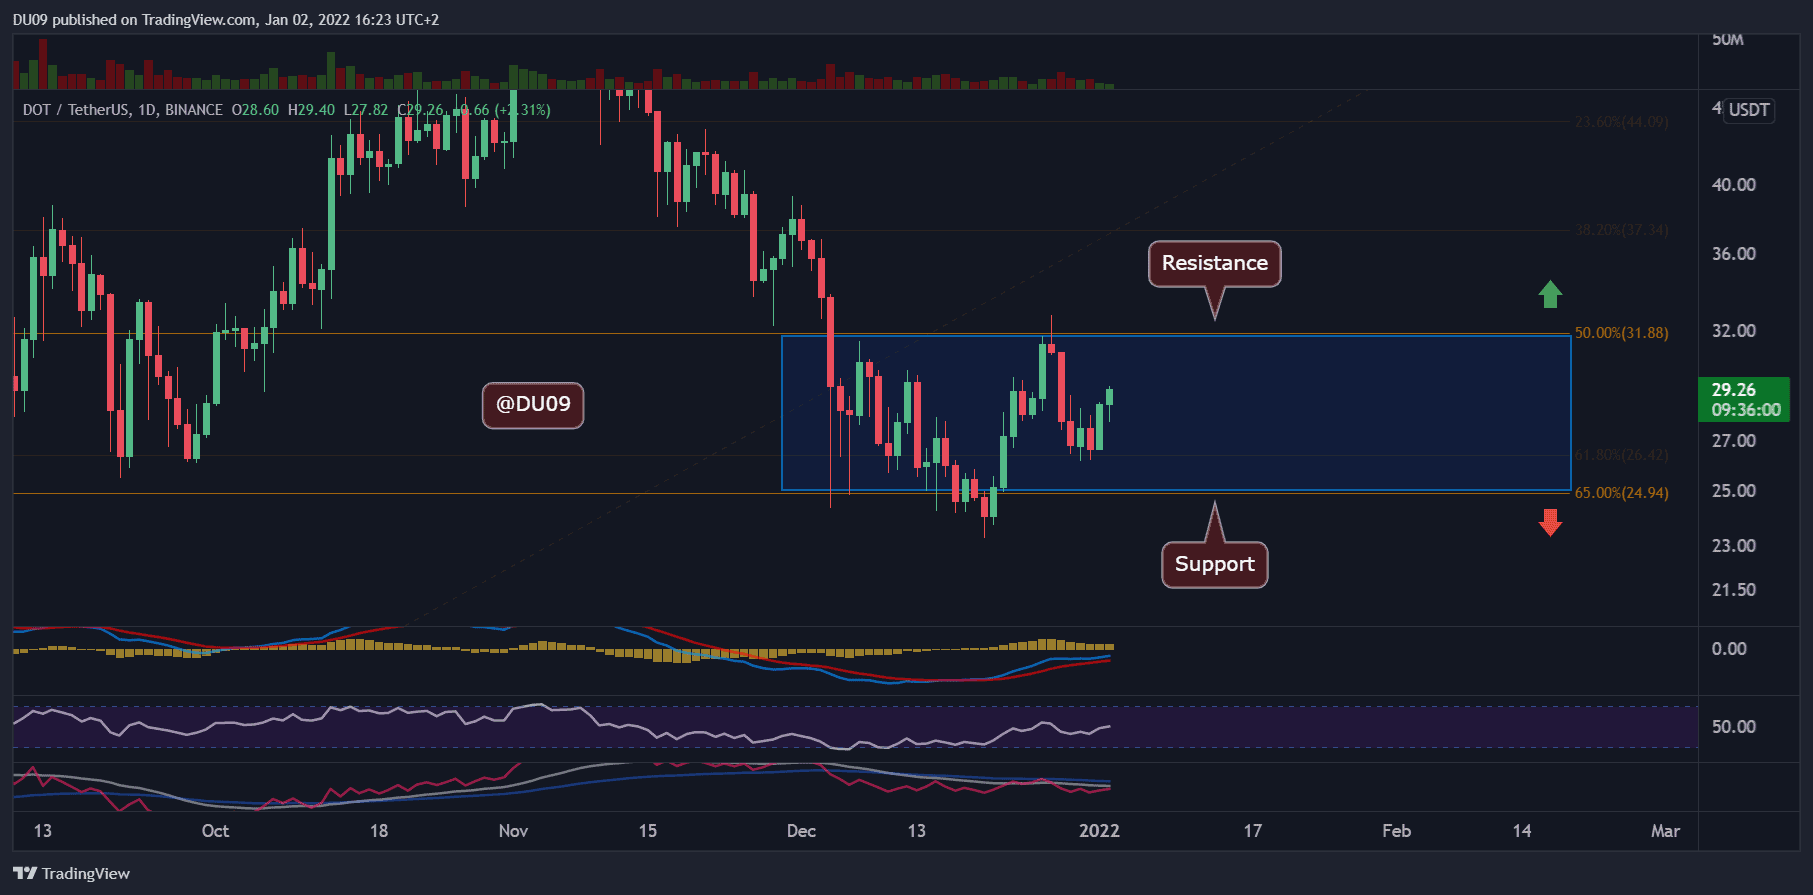
Technical Indicators
Trading Volume: A reasonable amount of volume on the last attempt on Monday to break above $32. The current volume is a bit low (maybe due to the weekend), but it favors the buyers right now. Watch out for the volume on Monday.
RSI: The RSI is making higher lows, which is a bullish sign, and is currently hovering just above 50 points – the neutral level.
MACD: The daily MACD is bullish and is heading up, despite the rejection at key resistance last Tuesday. This is a promising sign for bulls.
Bias
The bias on DOT is somewhat bullish, but a break of the critical resistance is needed to confirm this.
Short-Term Prediction for DOT Price
DOT managed to stop the downtrend and consolidate under the key resistance at $32. Now, buyers appear eager to take DOT back up again as they prepare the stage to break the key resistance. Should they fail, DOT will face the ‘floor’ level at $25. Watch out for possible volatility to return next week following the new year holiday.