Watch These Metrics During the Ongoing SOL Rollercoaster (Solana Price Analysis)
Solana is back at the key resistance, and the question remains if it will be able to break above it.
Key Support levels: $50, $44
Key Resistance levels: $67
1. Resistance under Pressure
SOL is consolidating under the key resistance at $67, but buyers appear keen to try and break it. The next few hours could be decisive.
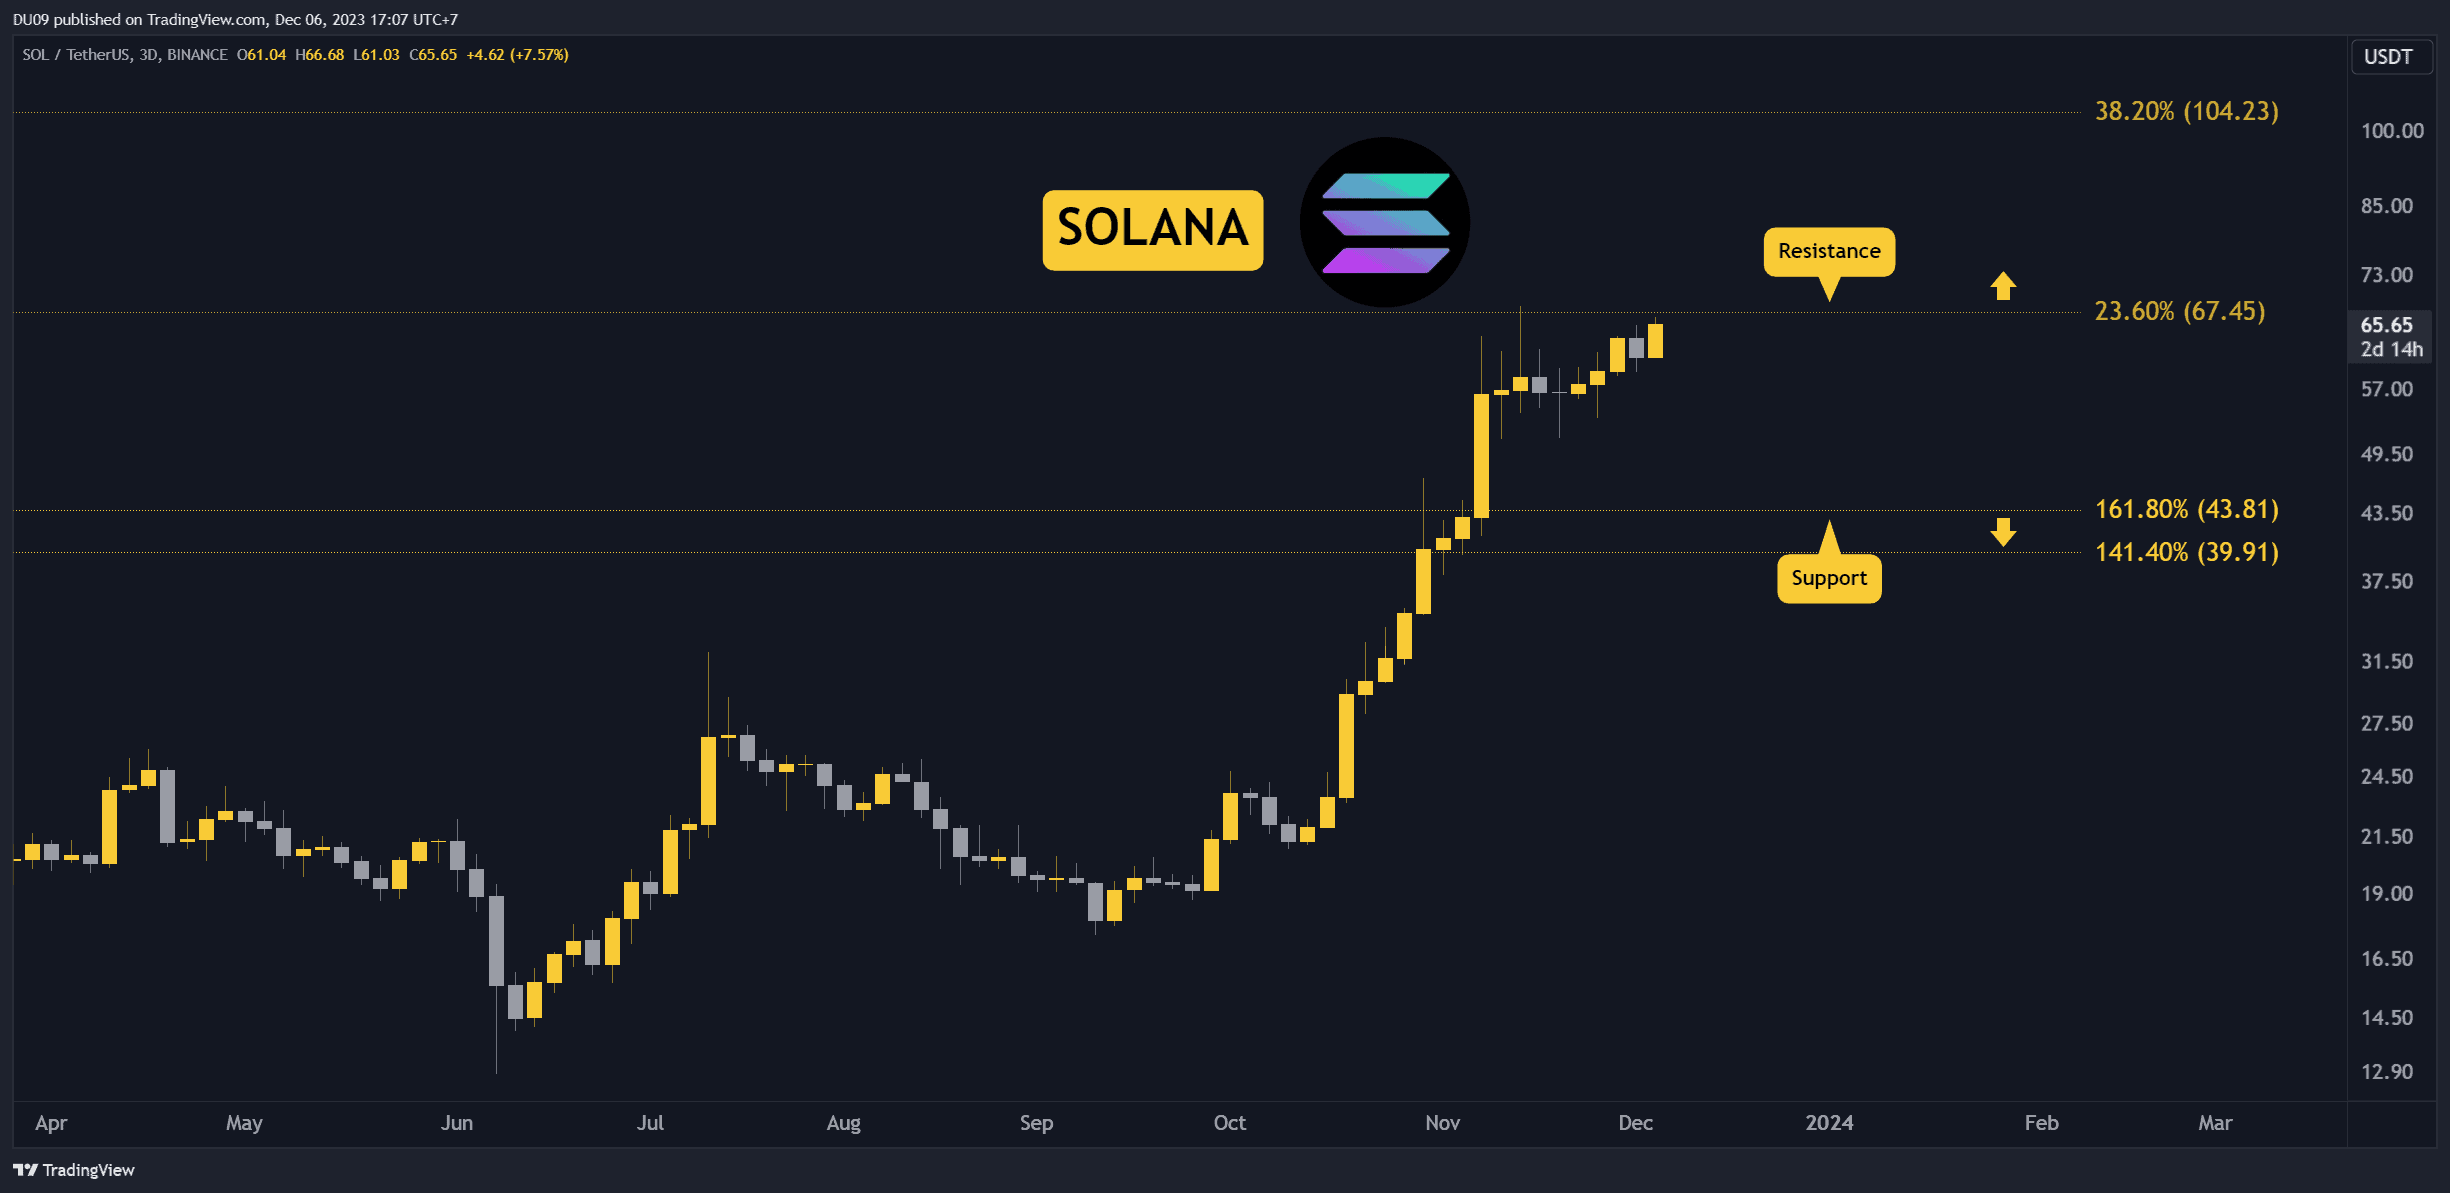
2. Key Support at $50
Should sellers return here, then Solana has good support at $50. This appears unlikely now, but it is not out of the question until the price breaks above $67.
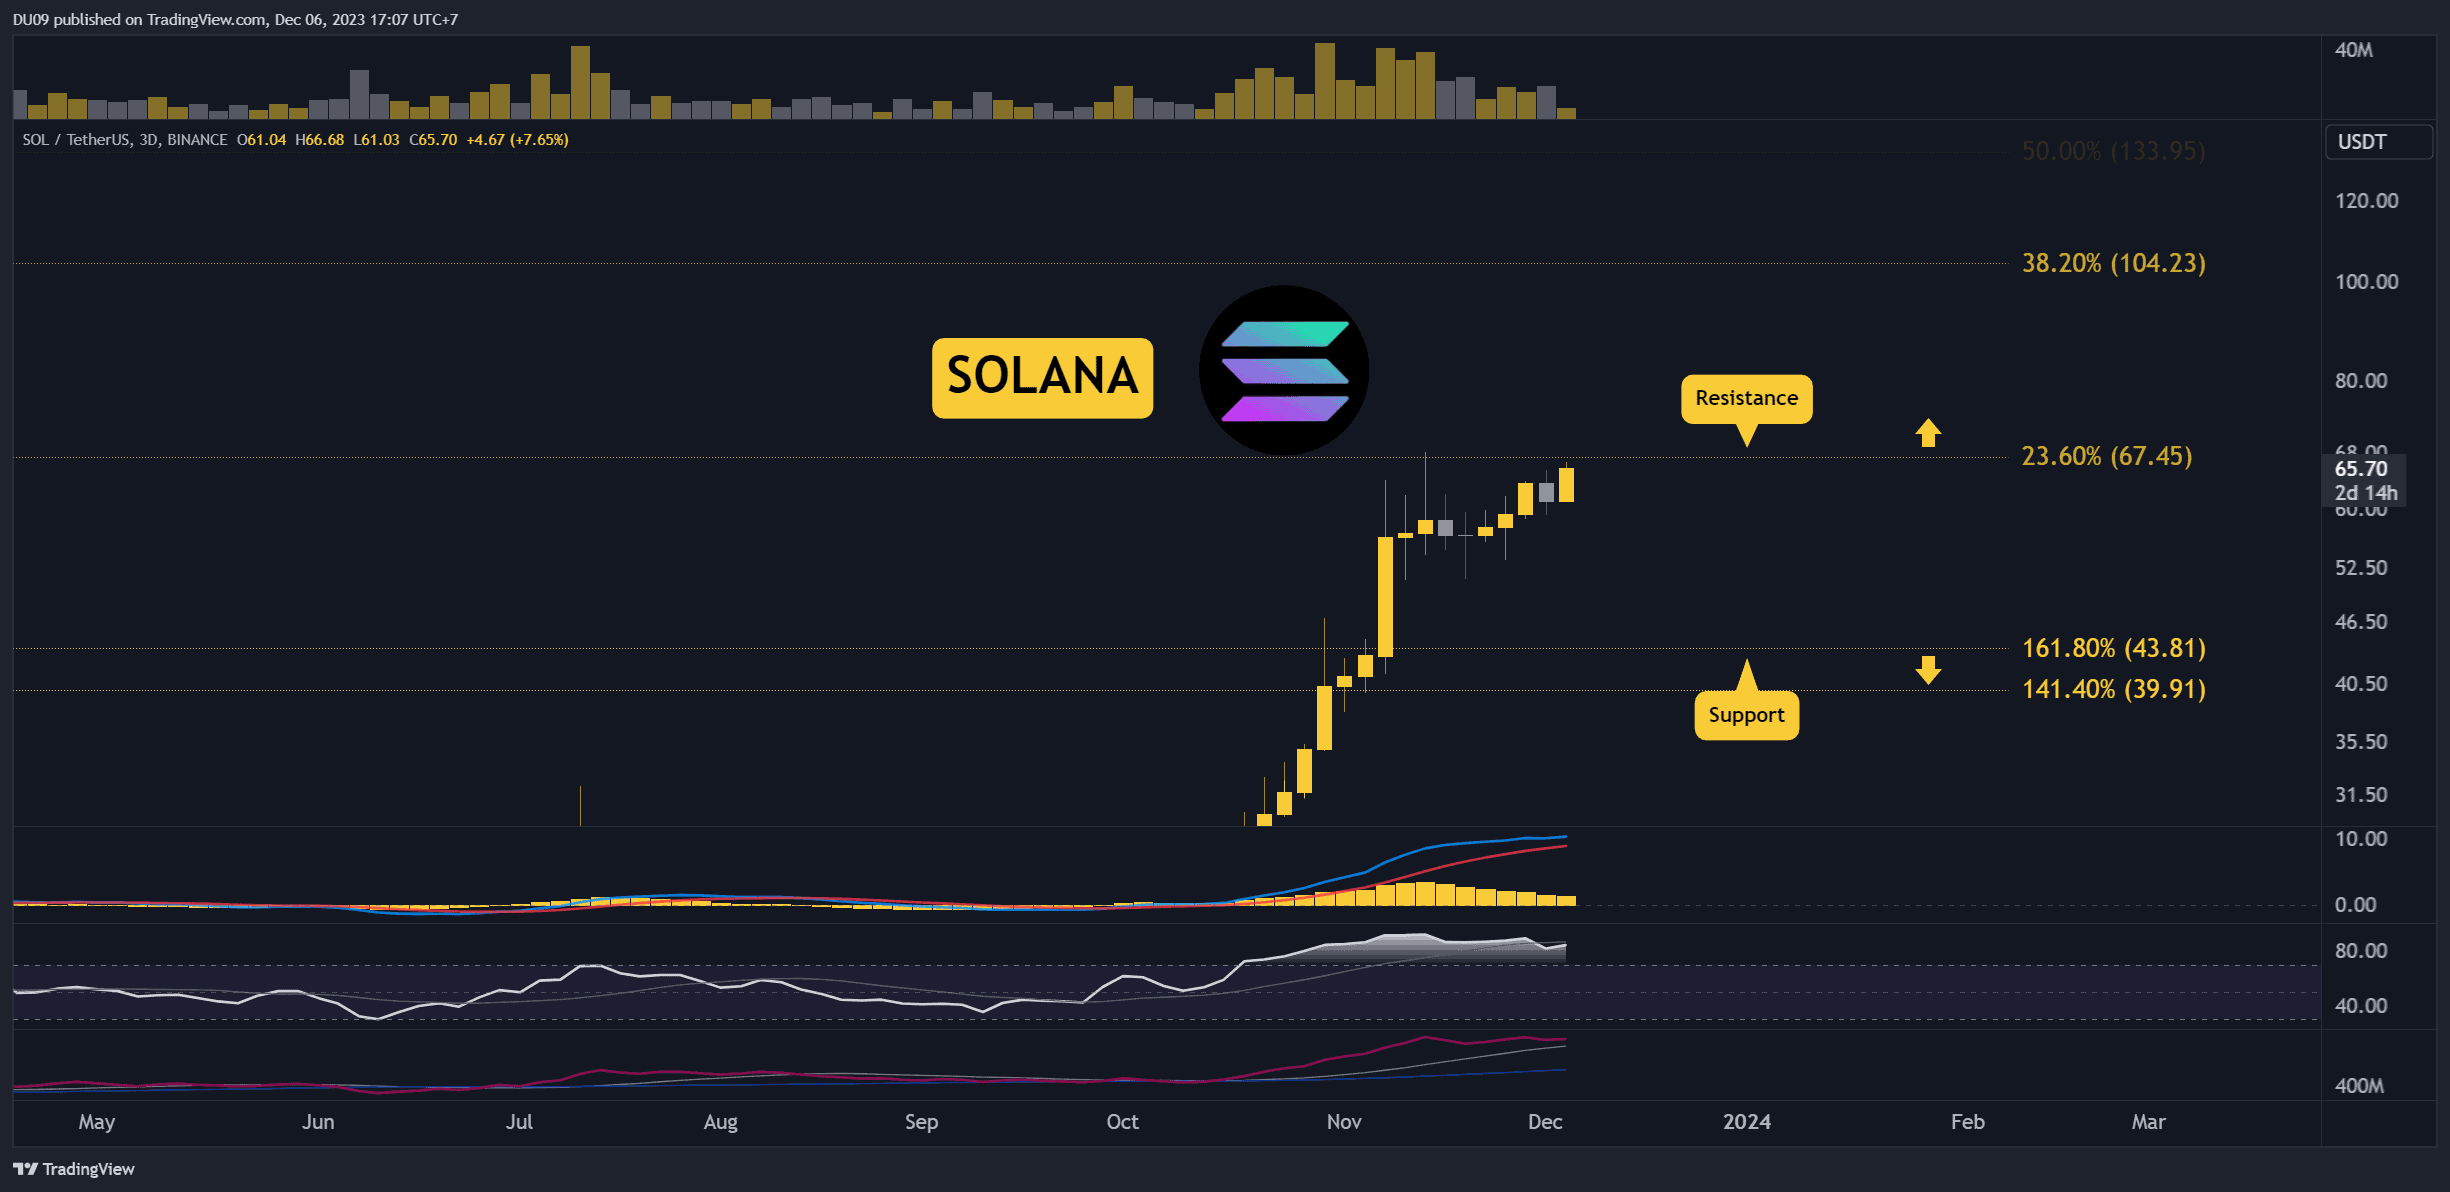
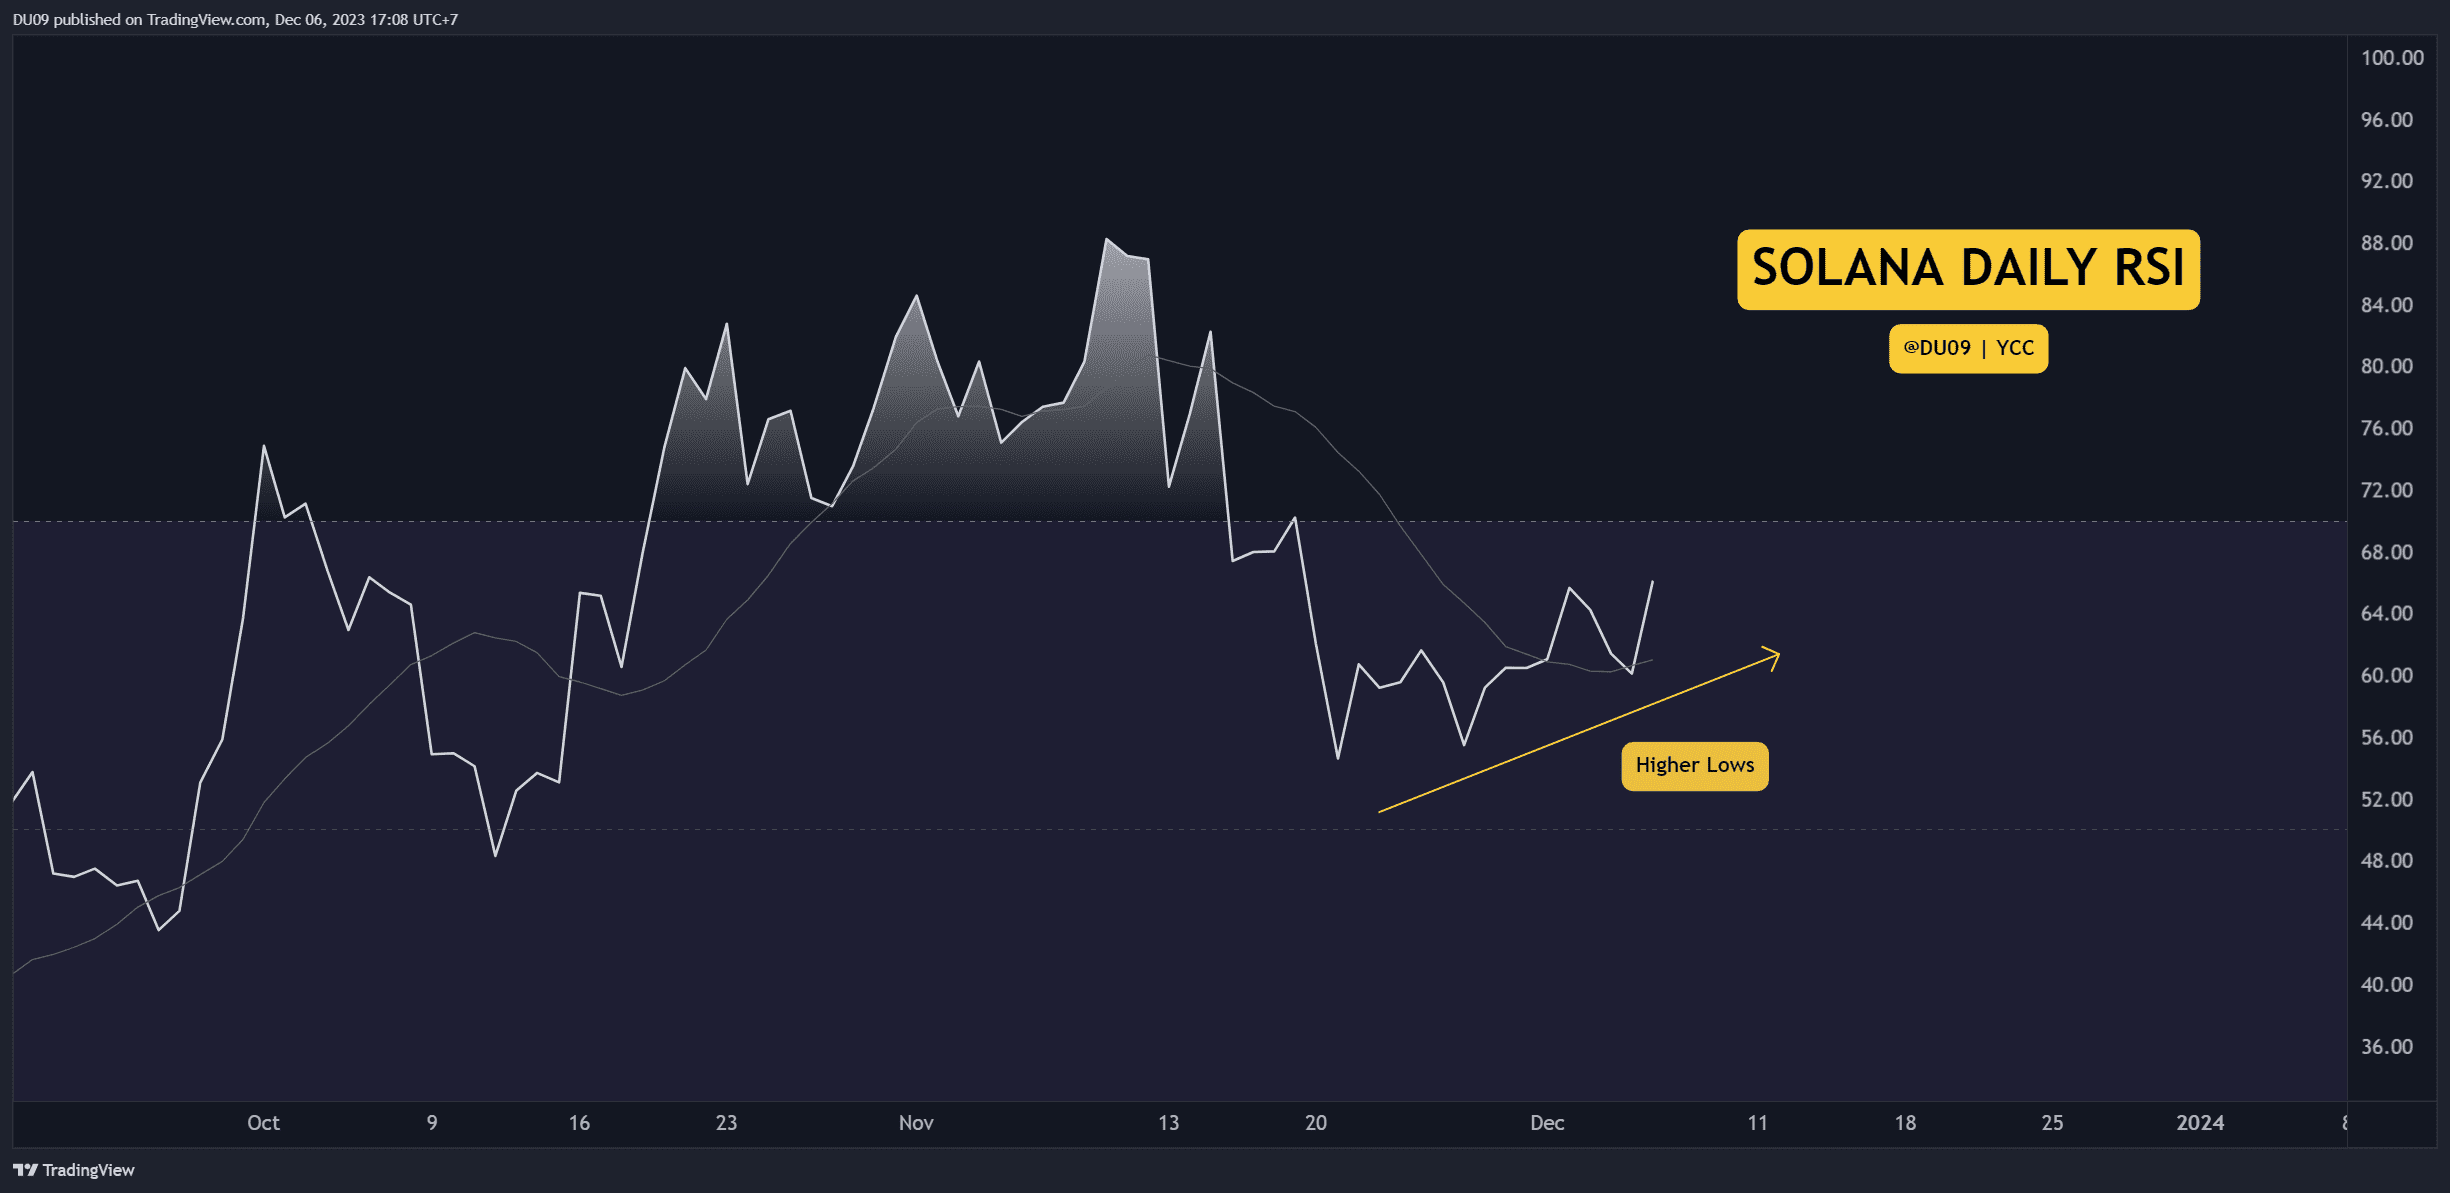
3. Daily RSI makes Higher Lows
The daily RSI is moving higher and continues to make higher lows. This is a bullish signal. If buyers manage to push it above 70 points, then the bias will turn positive once more.
Bias
The bias for SOL is neutral as long as the resistance holds.
Short-Term Prediction for SOL Price
Solana has to break above $67 to turn bullish. This could happen at any moment if momentum remains strong.
The post Watch These Metrics During the Ongoing SOL Rollercoaster (Solana Price Analysis) appeared first on CryptoPotato.