LINK Bulls Activate With 12% Daily Increase But Can They Break $12.5 Resistance? (Chainlink Price Analysis)
LINK/USD – Bulls Form Ascending Price Channel
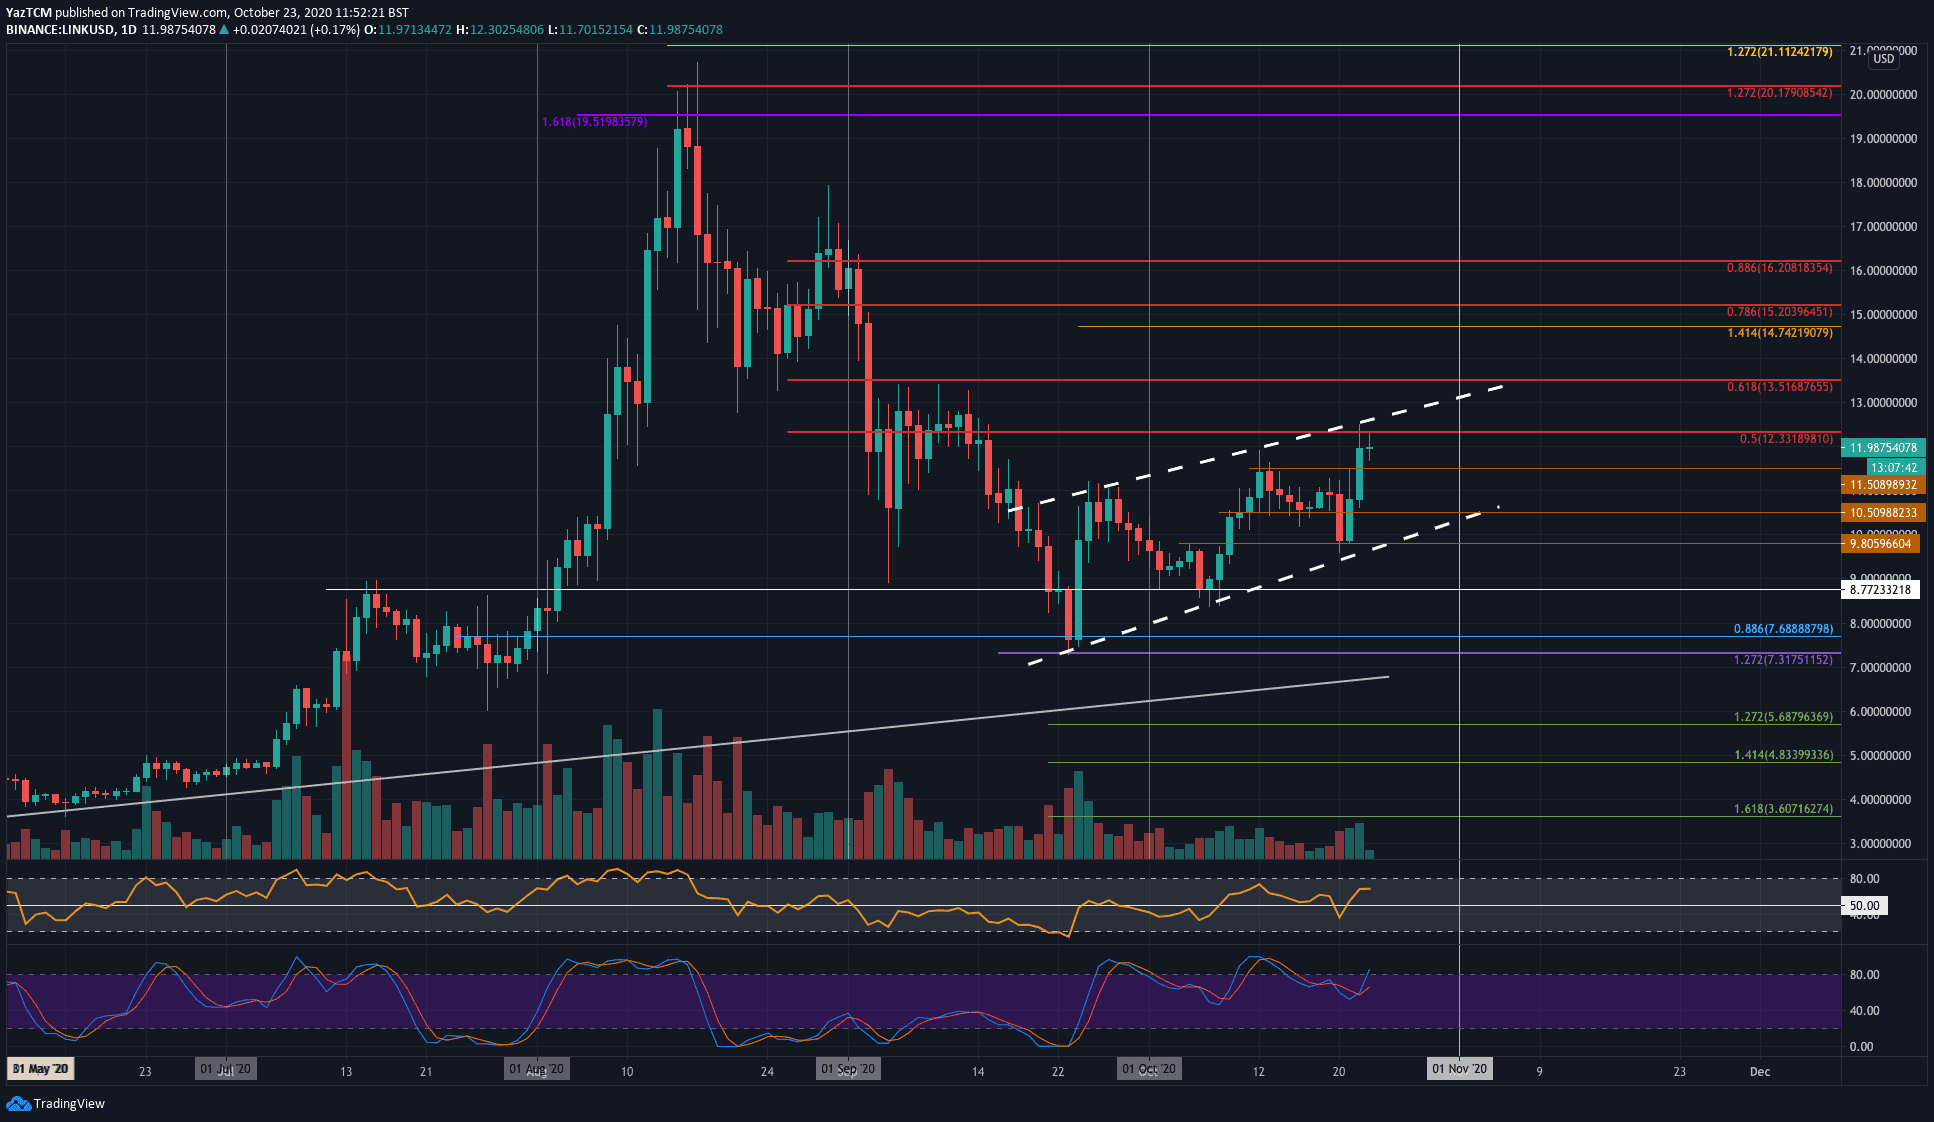
Key Support Levels: $11.50, $11, $10.50.
Key Resistance Levels: $12.33, $13, $13.50.
LINK bounced higher from the support at $8.77 at the start of October. From there, it started to form an ascending price channel. The coin recently bounced higher from the lower boundary of this price channel as it reversed from the $9.80 support on Wednesday.
Yesterday, LINK pushed as high as $12.33, where it met resistance at a bearish .5 Fib Retracement combined with the channel’s upper boundary. LINK is now trading at $12 as it faces the $12.33 resistance.
LINK-USD Short Term Price Prediction
If the buyers can break the resistance at $12.33 and push above the channel’s upper boundary, the first level of resistance lies at $13. Above this, resistance is expected at $13.50 (bearish .618 Fib), $14, $14.72, and $15.20 (bearish .786 Fib).
On the other side, the first level of support lies at $11.50. Beneath this, additional support lies at $11, $10.50, $10, and $9.80 (lower boundary of price channel).
There is some bearish divergence that could potentially be forming between RSI and the price. It will be important to watch this divergence to see if it plays out over the next few days as it could potentially send LINK toward the lower boundary of the price channel again.
LINK/BTC – Buyers Battling To Reclaim 0.001 BTC.
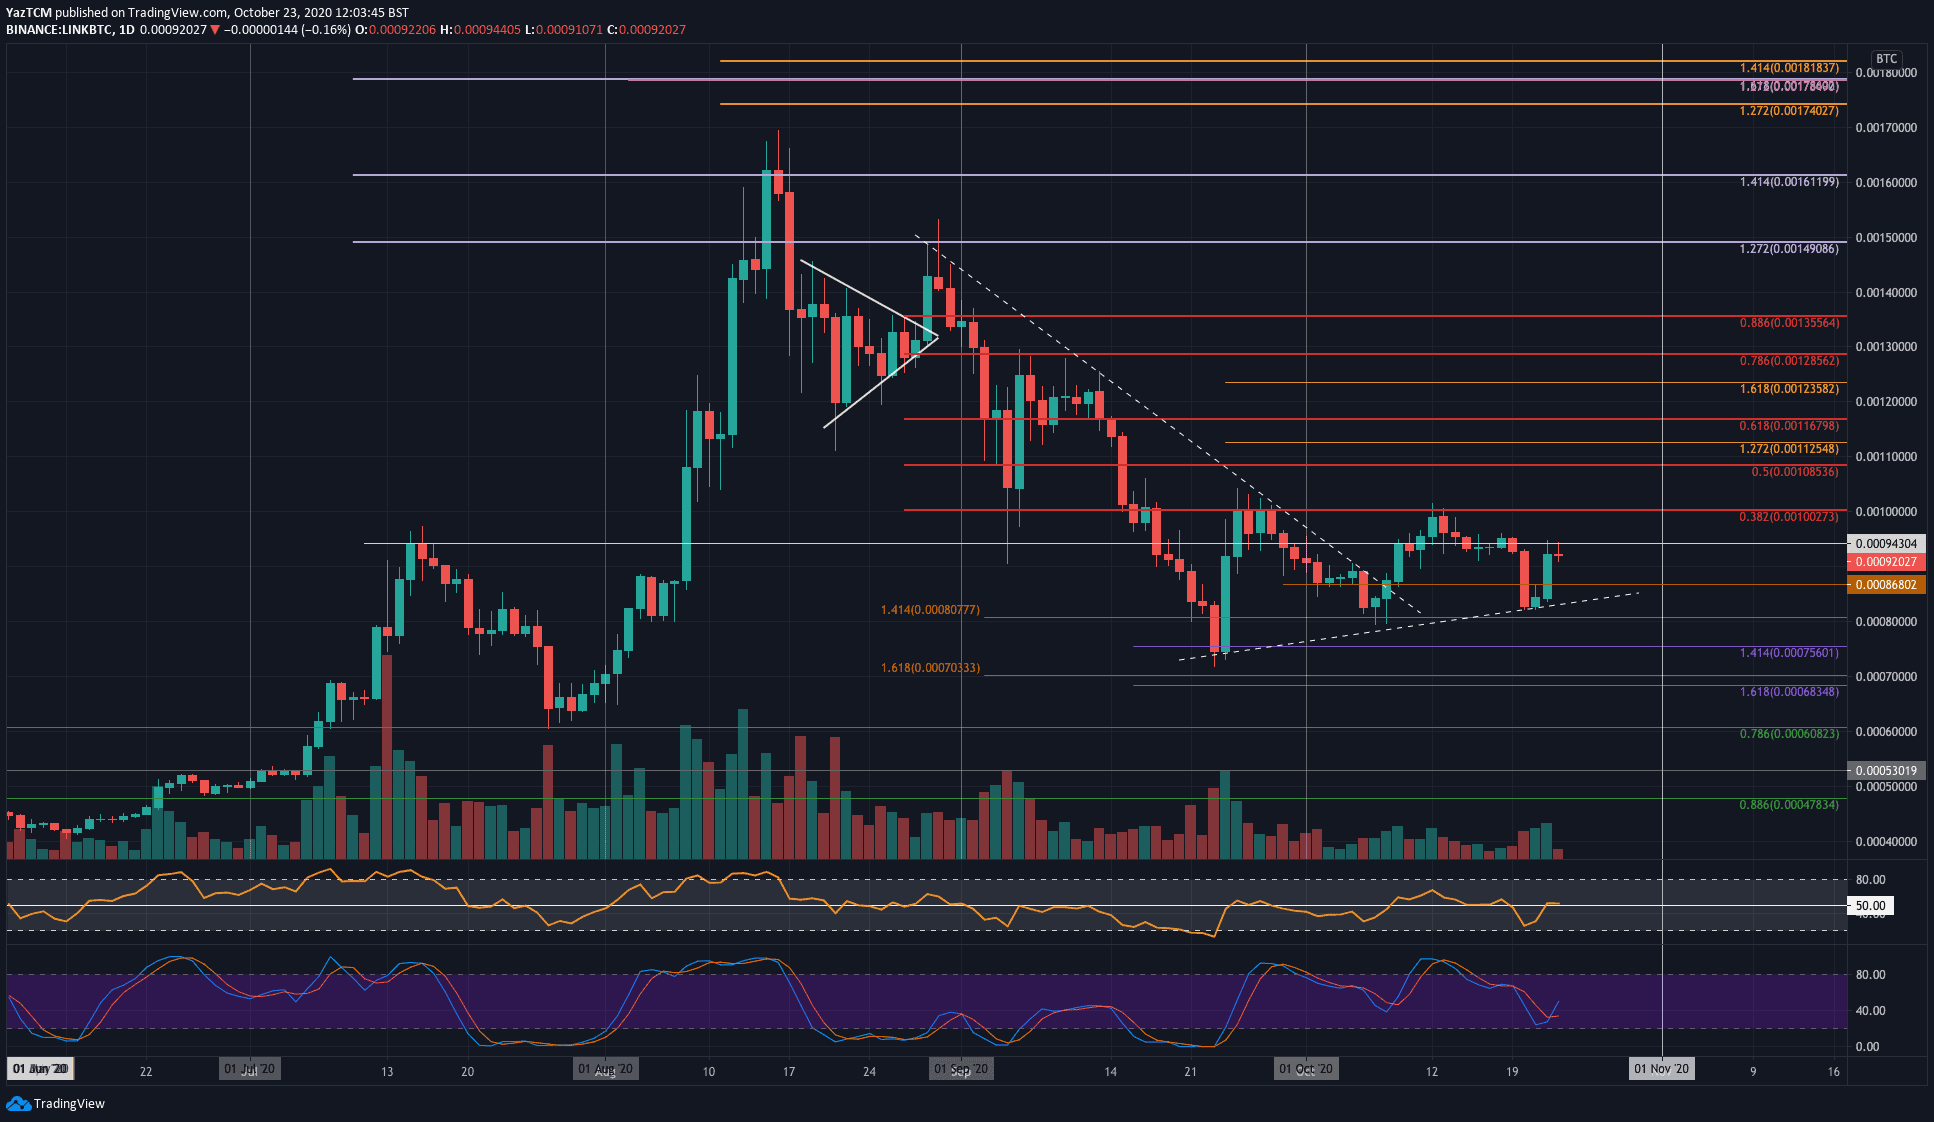
Key Support Levels: 0.0009 BTC, 0.000868 BTC, 0.00082 BTC..
Key Resistance Levels: 0.00094 BTC, 0.001 BTC, 0.00108 BTC.
Against Bitcoin, LINK is currently trading at the 0.0094 BTC resistance level. The buyers attempted to break above 0.001 BTC earlier in the month but failed miserably. A bearish .382 Fib Retracement level provides the resistance here, and it caused LINK to roll over until support was found at 0.00082 BTC a few days ago.
Since reaching this support, LINK has rebounded higher and is now facing resistance at 0.00094 BTC before it can make another attempt at 0.001 BTC.
LINK-BTC Short Term Price Prediction
Looking ahead, once the buyers break 0.00094 BTC, the first level of resistance lies at 0.001 BTC (bearish .382 Fib). This is followed by resistance at 0.00108 BTC (bearish .5 Fib), 0.00112 BTC, and 0.00116 BTC (bearish .618 Fib).
On the other side, the first level of support lies at 0.0009 BTC. This is followed by added support at 0.000868 BTC, the rising trend line, 0.0008 BTC, and 0.00075 BTC (downside 1.414 Fib extension – purple).
The Stocahstic RSI recently produced a bullish crossover signal that allowed LINk to rebound higher.
The post LINK Bulls Activate With 12% Daily Increase But Can They Break $12.5 Resistance? (Chainlink Price Analysis) appeared first on CryptoPotato.