Here Are Two Critical Levels to Watch as XRP Tumbles Below $0.48 (Ripple Price Analysis)
After a period of relatively subdued price movements in Ripple, hovering above and near the critical support zone represented by the 200-day moving average, sellers have finally pushed the price below this crucial indicator, signalling a clear bearish outlook for Ripple’s trajectory.
Technical Analysis
By Shayan
The Daily Chart
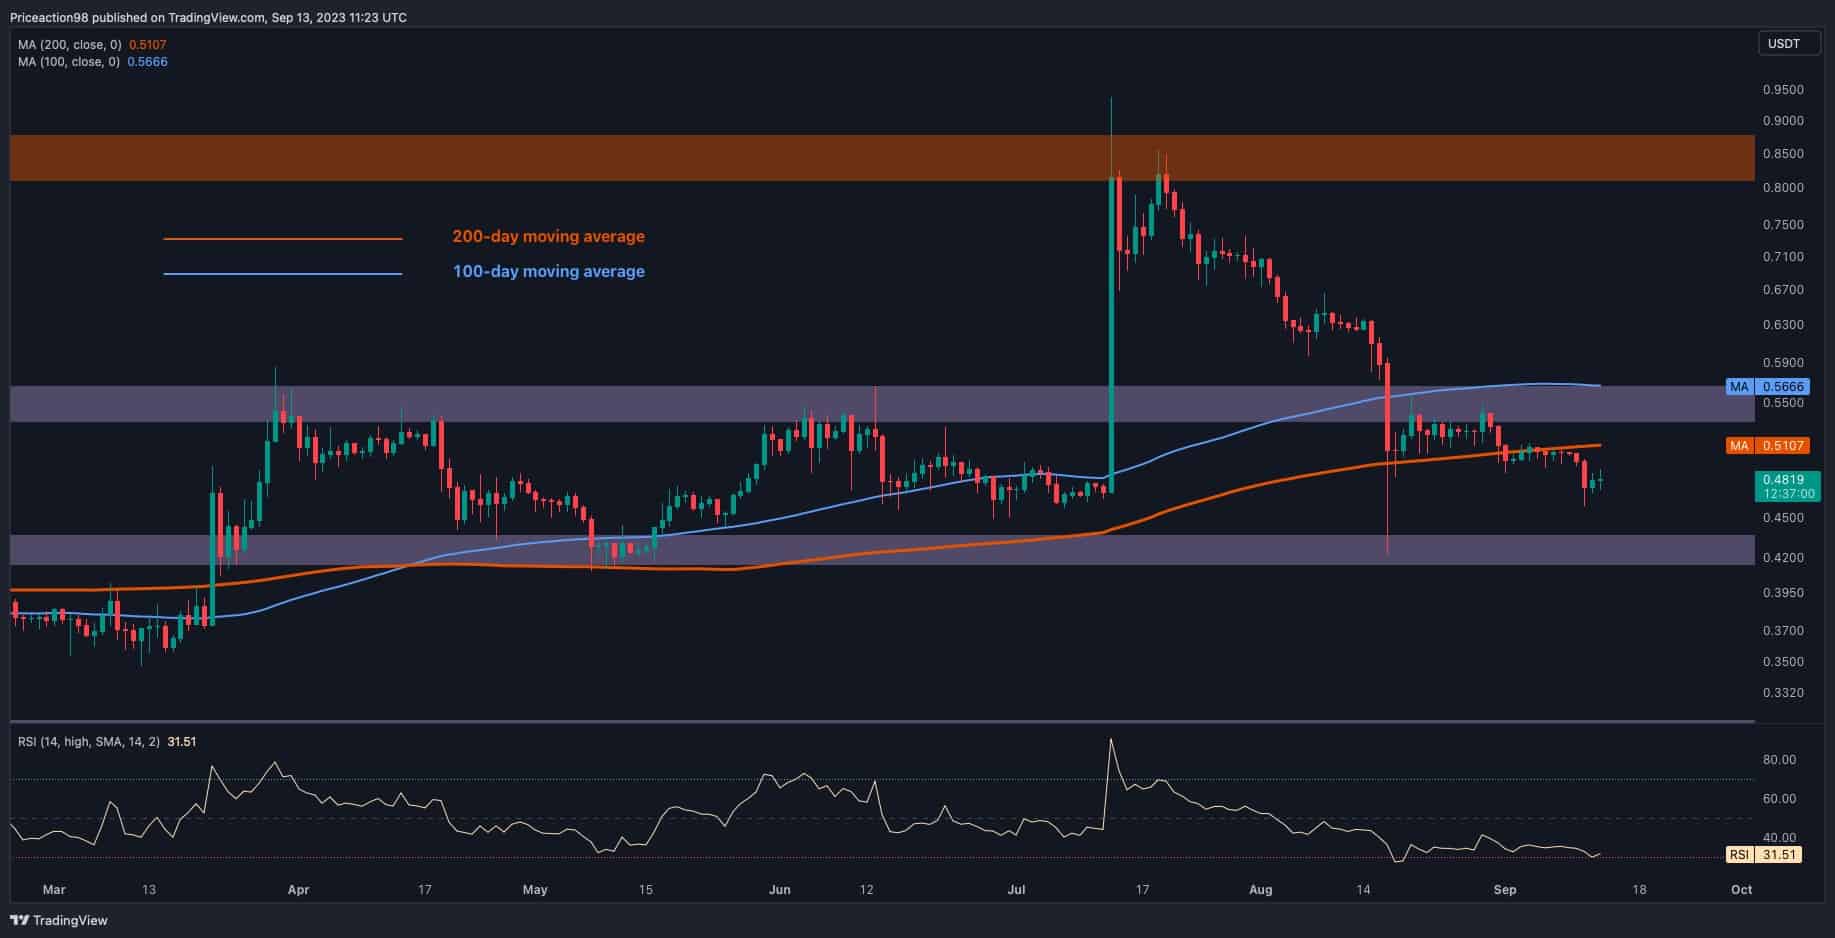
A detailed examination of the daily chart reveals a multi-week consolidation phase that unfolded after the rapid rebound above the 200-day MA in mid-August. Ripple’s price exhibited slight volatility throughout this consolidation period, remaining near the 200-day MA, at approximately $0.51.
However, the scales tipped in favor of sellers as supply outpaced demand, leading to a surge in selling pressure and, consequently, a drop below the 200-day MA. This MA is typically considered a significant level of either support or resistance, and its breach underscores the prevalence of bearish sentiment in the market, with the potential for further downward movement.
While a modest upward retracement, creating a pullback towards the broken MA, remains a possibility, the overall outlook for Ripple is bearish, with the next likely destination being the critical support zone at $0.42. Therefore, the forthcoming price action is of utmost importance, as it could potentially determine the path ahead for Ripple.
The 4-Hour Chart
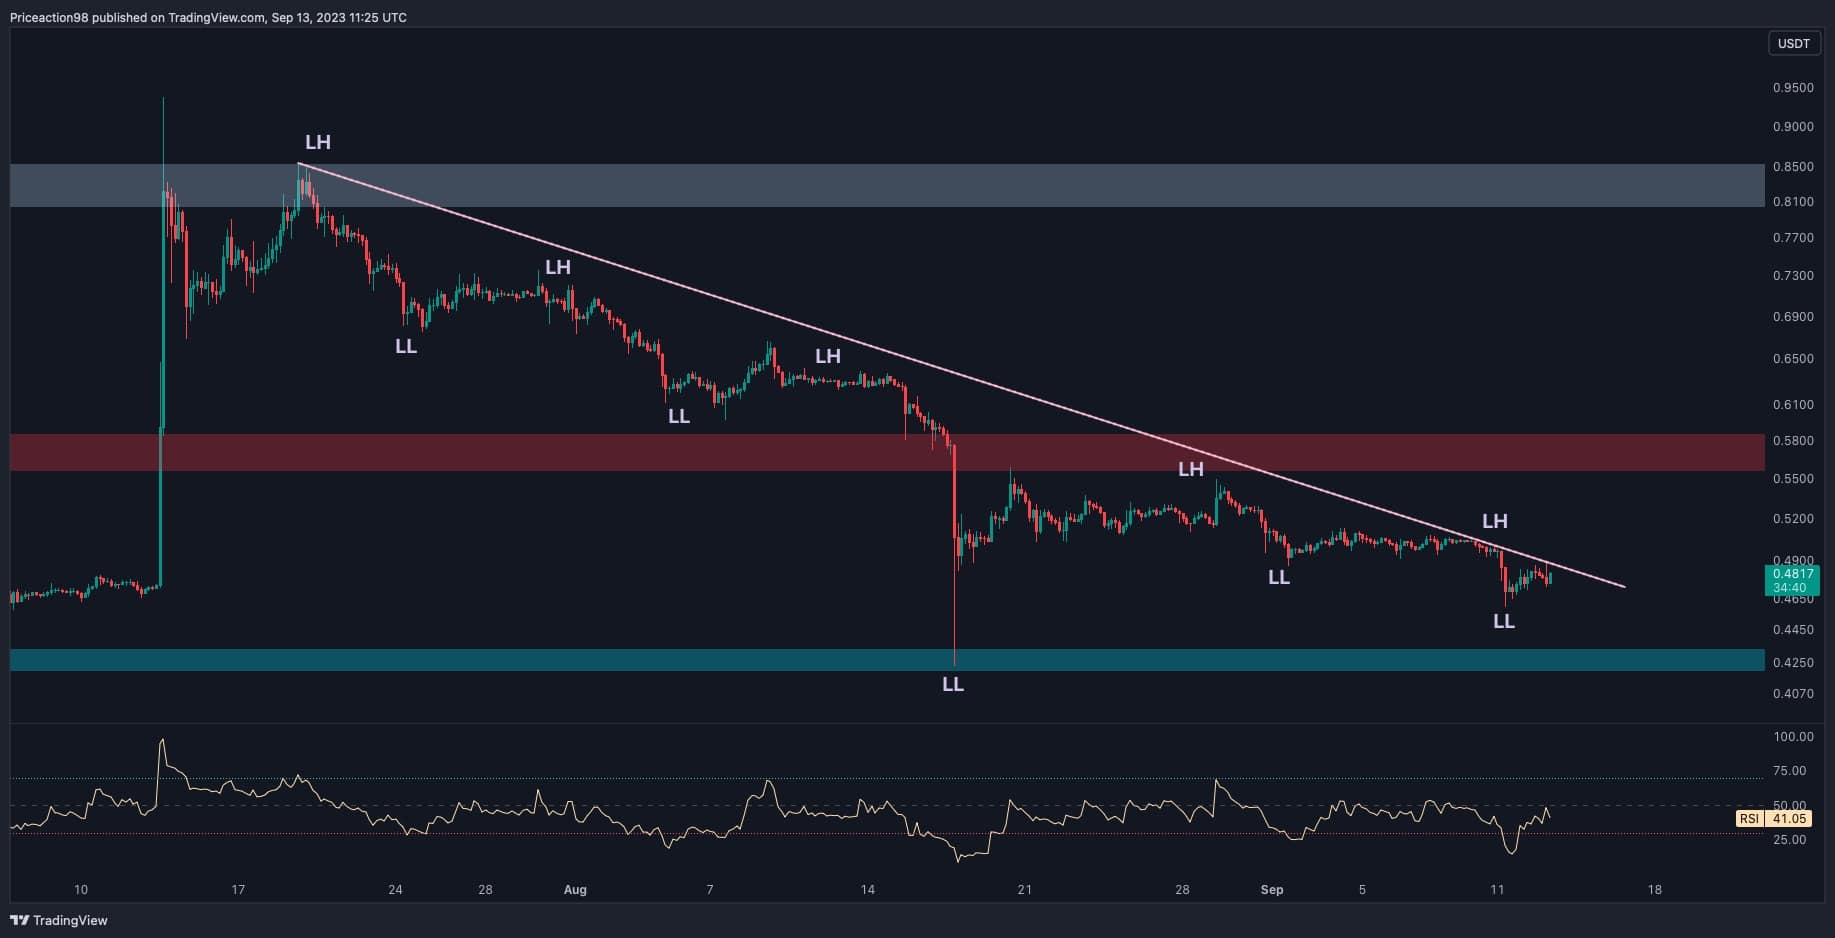
Shifting our focus to the 4-hour chart, a well-defined multi-month downtrend becomes evident, characterized by Ripple’s consistent formation of lower highs and lower lows. These lower price swings underscore a robust downtrend in Ripple’s price.
The price is grappling with the multi-month descending trendline, attempting to break above it. Given that this trendline is a resistance zone, the most probable scenario is a rejection, leading to another leg of bearish movement and potentially forming a new lower low.
However, if buyers successfully maintain the price near this pivotal trendline and drive it above, the scenario could become bullish. It’s crucial to note that this breakout will only be confirmed once the price retraces to retest the breached trendline and forms a pullback. Such a scenario might propel XRP towards higher price levels, with the potential for a surge toward the static support at $0.55.
Regardless of the outcome, continuous vigilance in monitoring price fluctuations remains essential, as the interplay between support and resistance levels will significantly influence Ripple’s immediate price trajectory.
The post Here Are Two Critical Levels to Watch as XRP Tumbles Below $0.48 (Ripple Price Analysis) appeared first on CryptoPotato.