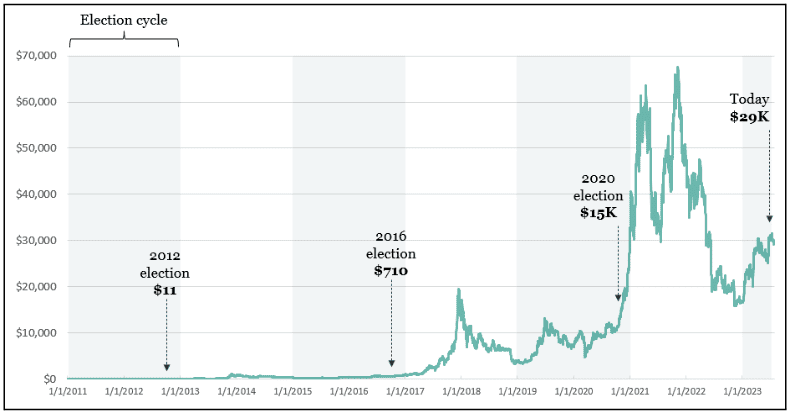
Grayscale’s Curious Graph of US Presidential Elections and Bitcoin’s Price
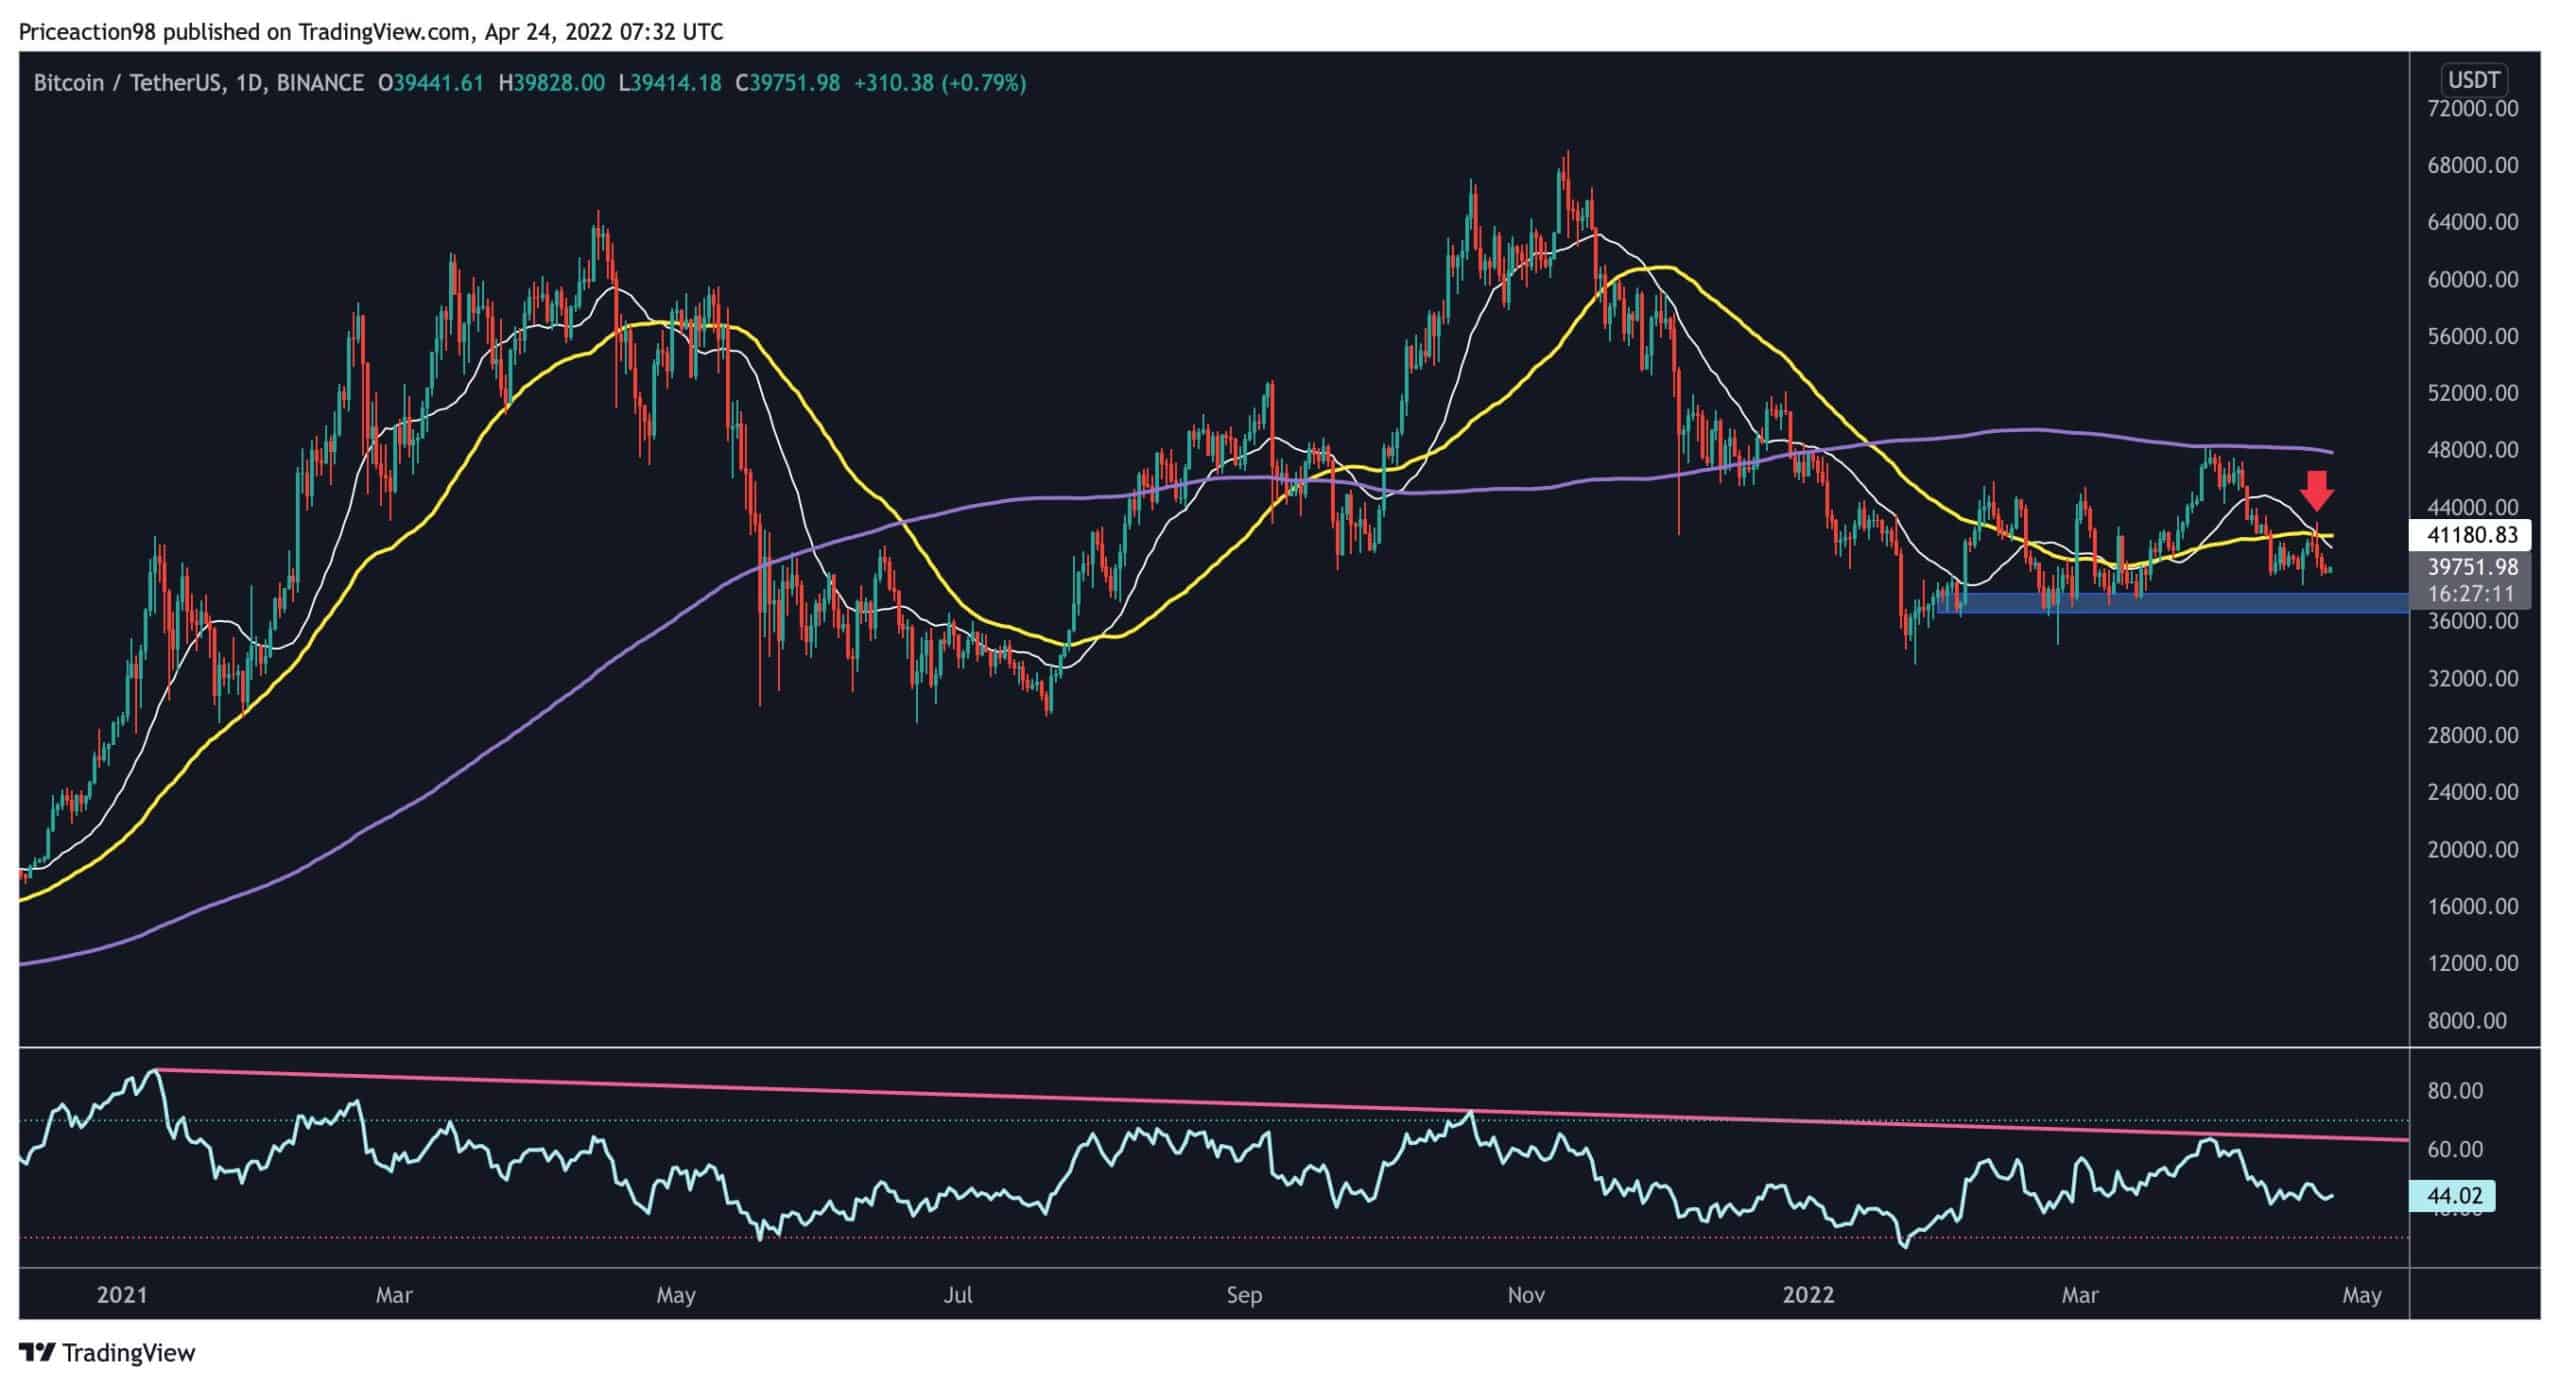
Bitcoin price has drifted downward some 3.7% on the 30-day window beginning the second week in August.
- Meanwhile, Grayscale Investments dropped beginning crypto investors a hint to research further:
“First, Bitcoin is currently at its highest price in an American Presidential election cycle; Bitcoin is currently trading above $29K, whereas the previous election cycle high in Q4 2020 was ~$20K.”
- During the 2012 presidential election, BTC’s price was $11. Four years later, during the 2016 election, it was $710. Four years after that, on Election Day 2020, BTC traded at $15,000. If it repeats the pattern, prices have a way up to go before the elections as well as after.
- Of course, any seasoned investor knows history isn’t guaranteed to repeat itself.
- But as it turns out, all crypto investors had to do for three price cycles was accumulate in the year before and during presidential election years. And keep buying straight through election day and then stop when prices blow up. Then start selling and get the IRS form for realized gains on property in your tax filings.
- Bitcoin truly is a currency of democratic values in a digital era. It’s so simple, the average voter now has access to what only Goldman Sachs clients had prior to 2009.
The post Grayscale’s Curious Graph of US Presidential Elections and Bitcoin’s Price appeared first on CryptoPotato.