Failure To Break Above $11K Could Send Bitcoin To Monthly Lows: BTC Weekend Price Analysis
Even though the past week was positive for Bitcoin, the recent price action could raise some question marks for the bulls.
After starting the week below $10,500, Bitcoin was able to break above the old tough resistance and reach back to the $11,000 area.
However, while BTC gained 5% over the past week, most of the leading cryptocurrencies lost market cap. LINK at -18% and even Ethereum at -2% are only two examples. The trending DeFi tokens suffered even harder.
This tells us that some or at least part of BTC’s price gains were coming from the altcoins sell-off, and not from funds entering crypto – just like in a healthy bull market.
Double-Top On the 4-Hour?
Looking at the following 4-hour chart, we can see a double top formation around $11,100, which is textbook bearish.
Moreover, there is also a bearish divergence on the RSI. This happens when the asset’s price is increasing, while the RSI is decreasing.
Another issue to consider is the decreasing amount of volume over the past week, which shows that the buyers are losing their power.
Despite the above, and just as in crypto, the momentum might change very quickly. Keep in mind that Bitcoin is also waiting for the equity and gold markets on Monday as both had a significant effect on the price recently.
The level to watch is, of course, the recent high from yesterday around $11,100. In case Bitcoin breaks above it (further above lies the 50-days MA at around $11,250), the momentum could change quickly.
However, as long as Bitcoin continues having trouble at that area, the price can easily drop.
From below, the first level of support lies around $10,800; followed by $10,500 and $10,400 – where lies the 100-days moving average line (the white line).
Total Market Cap: $357 billion
Bitcoin Market Cap: $202 billion
BTC Dominance Index: 56.8%
*Data by CoinGecko
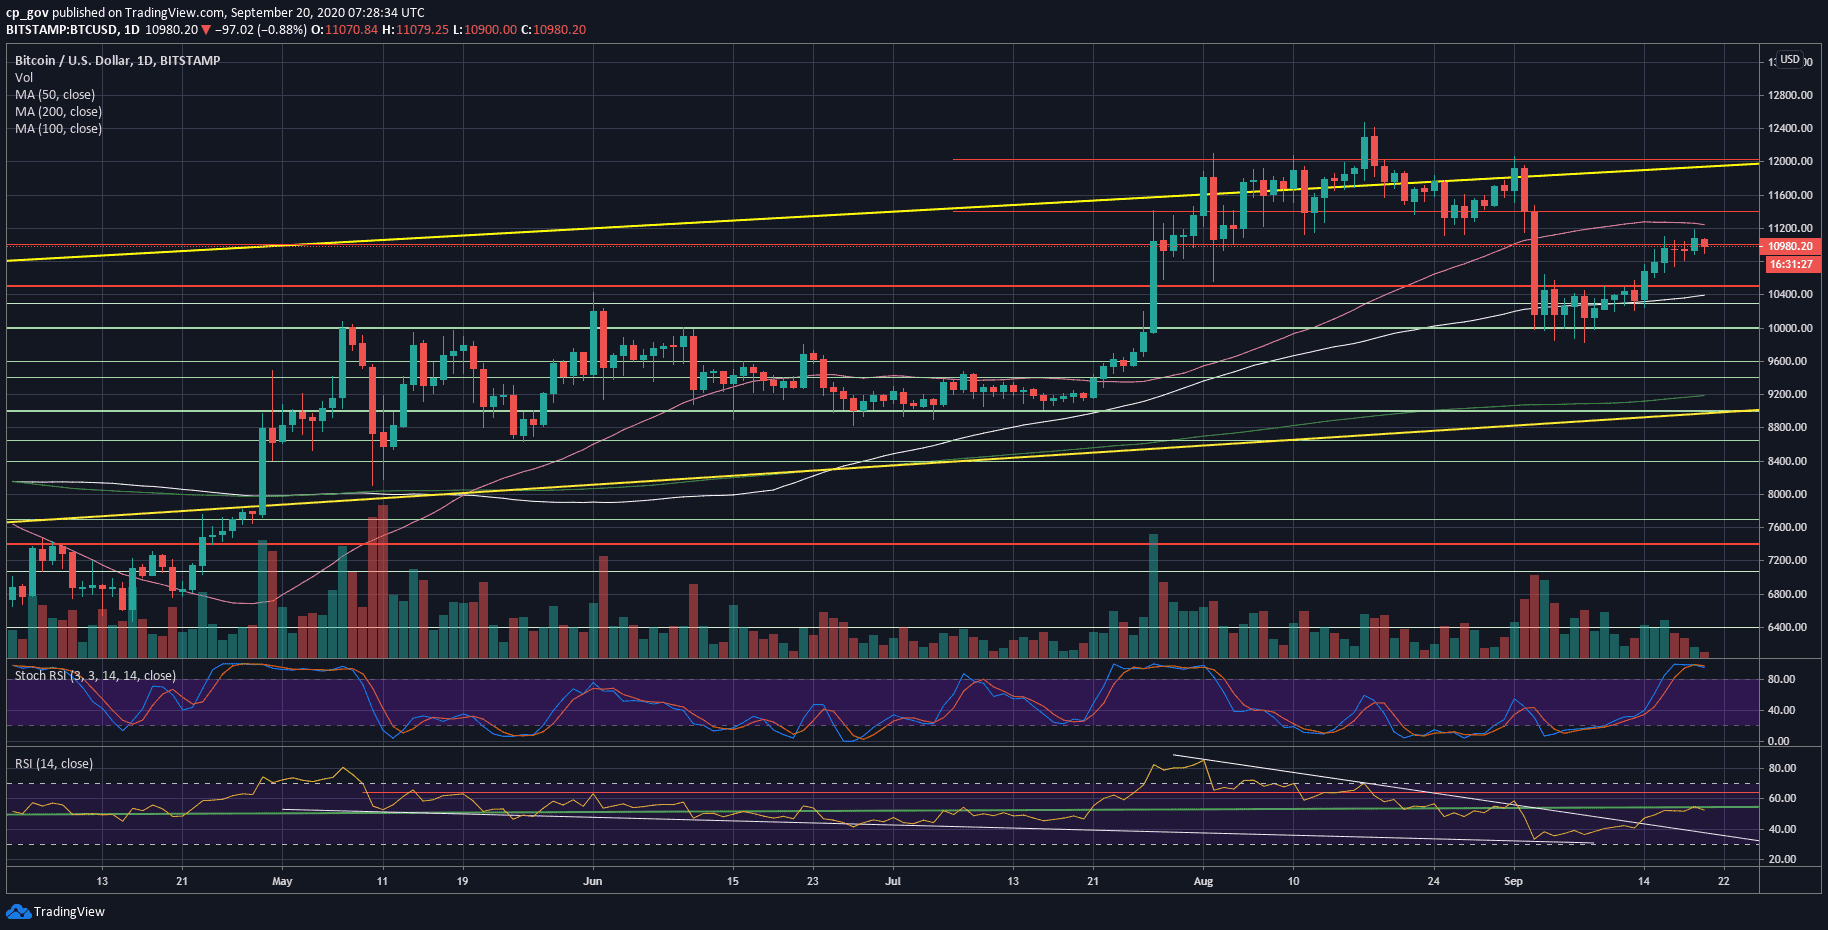
BTC/USD BitStamp 1-Day Chart
BTC/USD BitStamp 4-Hour Chart

The post Failure To Break Above $11K Could Send Bitcoin To Monthly Lows: BTC Weekend Price Analysis appeared first on CryptoPotato.