Crypto Trading Academy: Price Moves Up While RSI Down? Meet Divergence to Anticipate Price Movements
TL;DR
- Price divergence in the crypto space can sometimes determine future price direction.
- Higher chart time frames often yield stronger, more impactful results.
- Combining market signals for confluence can be important when conducting technical
Everyone in crypto wants an answer to the golden question: where will the price go next? Although no one truly knows future price action until it happens, price divergence can sometimes be used to help answer that question.
Divergence occurs when price makes higher highs, while indicators paint lower lows or vice versa. Simply put, divergence is when price direction contradicts indicator direction, creating a noticeable conflicting pattern.
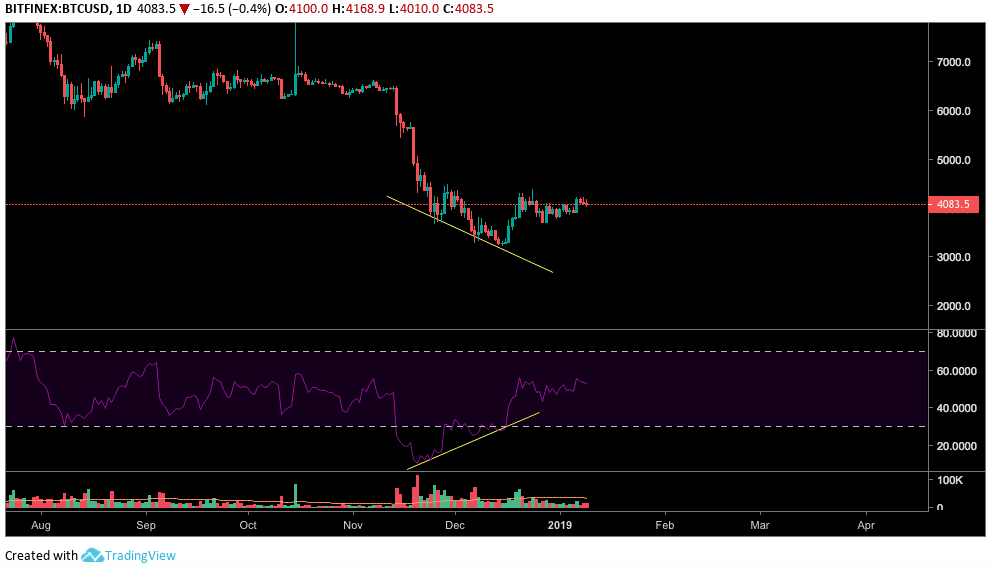
Image Courtesy: Tradingview.com
As shown in the Bitcoin daily chart pictured above, divergence is seen between price action and the Relative Strength Index (RSI – Purple line). Price showed a clear downward trend, while the RSI showed an upward trend. This means that although the price may be falling, market sentiment is gaining strength.
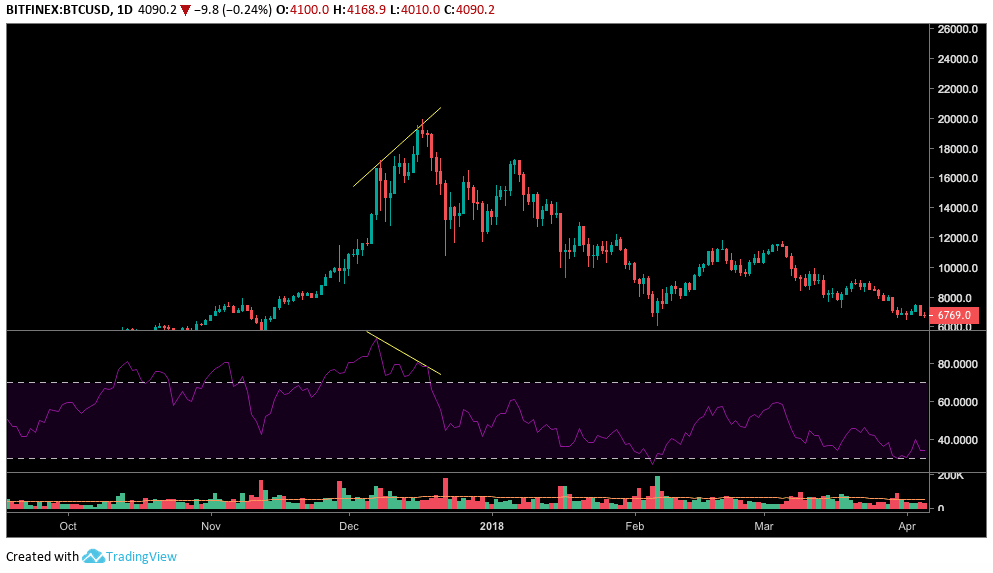
This concept also works oppositely as well, as seen in another daily bitcoin chart example above. A definite negative divergence was seen during bitcoin’s climb to all-time high prices. As price climbed toward its peak, the RSI posted a downward pattern, indicating a market reversal.
As with many chart patterns and concepts, divergences must be noted about their time frames. Divergences can often be spotted in many different time frames, even including short-term charts like the 15-minute chart although it is important to note that higher time frame divergences often have more weight and impact. In other words, it can be easy to miss the bigger picture while being too focused on the present.
Not On The Divergence Alone
Additionally, it is essential to apply the concept of divergence with other factors, such as support and resistance levels or moving averages. Technical analysis is often a game of confluence. One view or indicator on its own often can be misleading. Using several methods together, however, can often be more effective.
It is also important to note that nothing is guaranteed (otherwise everyone was rich). Price can make unexpected moves, even regarding larger time frames with multiple signals of confluence. Even textbook plays can take unexpected turns.
The post Crypto Trading Academy: Price Moves Up While RSI Down? Meet Divergence to Anticipate Price Movements appeared first on CryptoPotato.