Ethereum Tests $2.4K as Bulls Look to Finally Take Control: ETH Price Analysis
Ethereum has been increasing in the past day in the hopes that an ETH ETF might be next in line on the SEC’s agenda.
Meanwhile, the probability of a further bullish continuation seems to remain high, considering what the charts are demonstrating.
Technical Analysis
By TradingRage
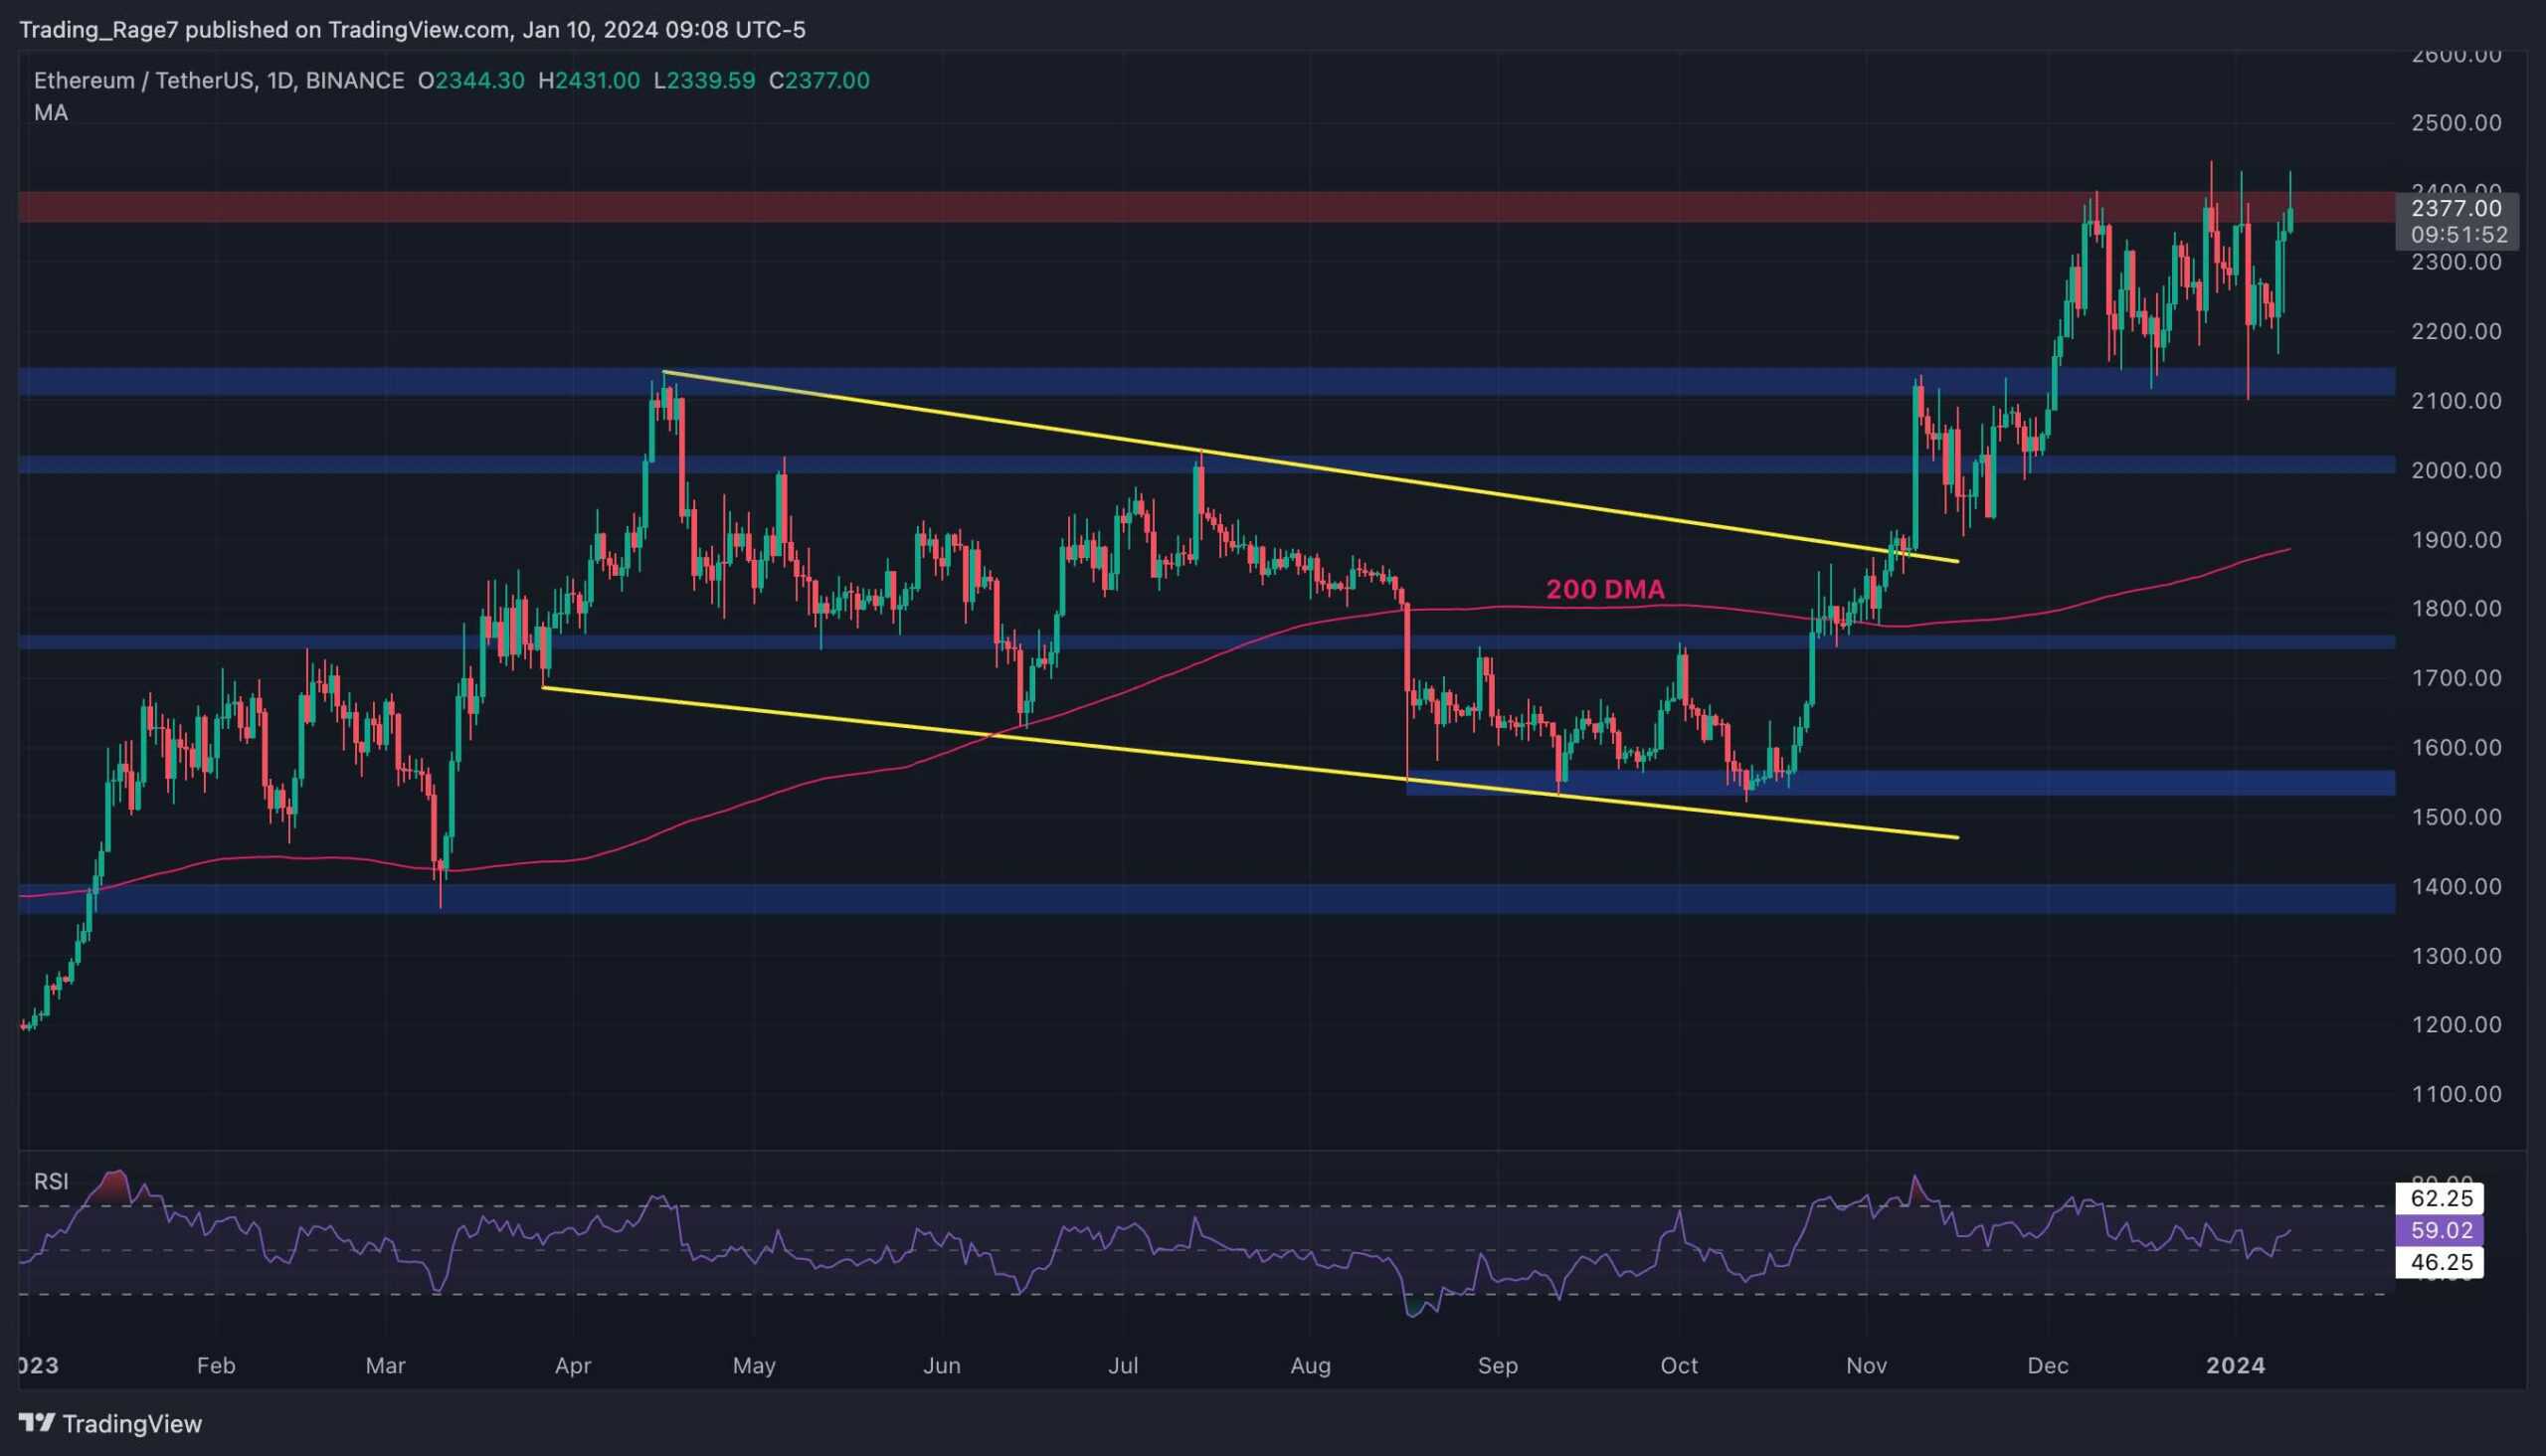
The Daily Chart
On the daily timeframe, the price has been trapped between the $2,100 and $2,400 levels over the last month. A breakout from either side of this range can determine the trend’s short-term direction.
A bearish breakout would likely result in a decline toward the 200-day moving average, located around the $1,900 mark. On the other hand, a break above the $2,400 level would pave the way for the price to target the $2,700 resistance zone in the upcoming weeks.
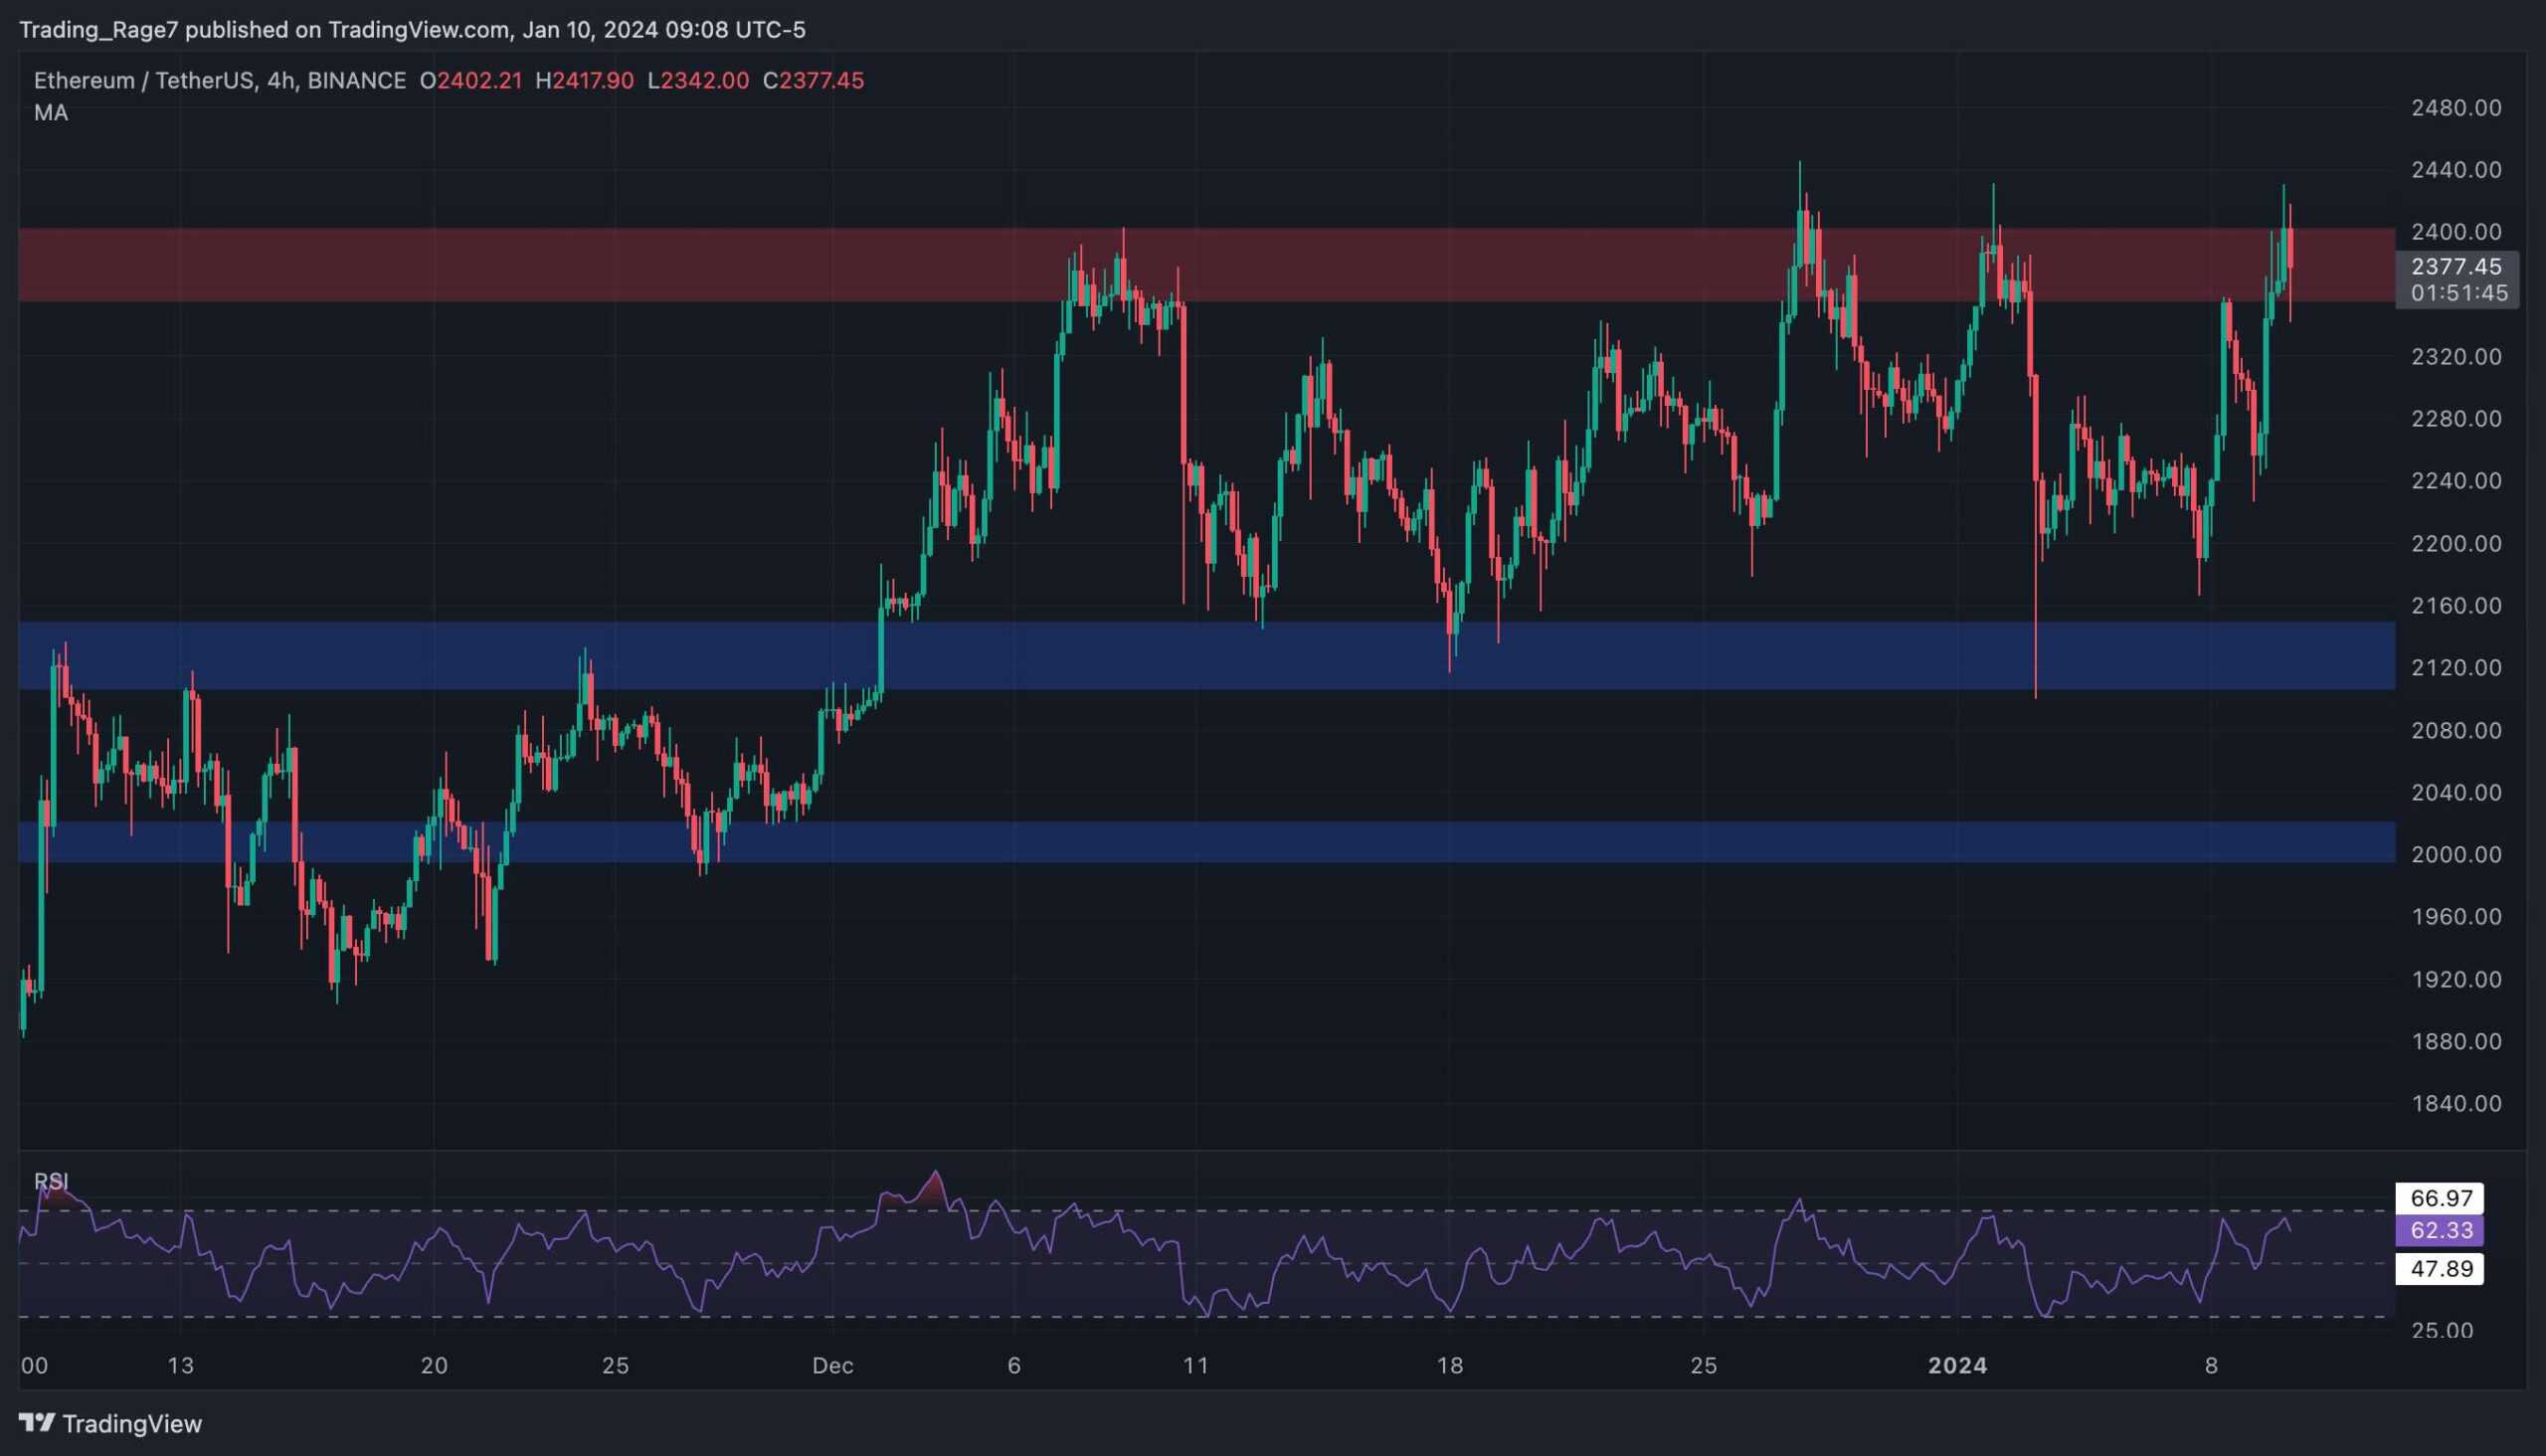
The 4-Hour Chart
Looking at the 4-hour chart, the recent choppy price action becomes much more clear. The cryptocurrency has tested both the higher and the lower boundary of the range several times.
Currently, the price is testing the $2,400 resistance area. A breakout from this level would result in a rally higher toward the $2,700 area, while a rejection could lead to a drop back to the support zone at $2,100.
Sentiment Analysis
By TradingRage
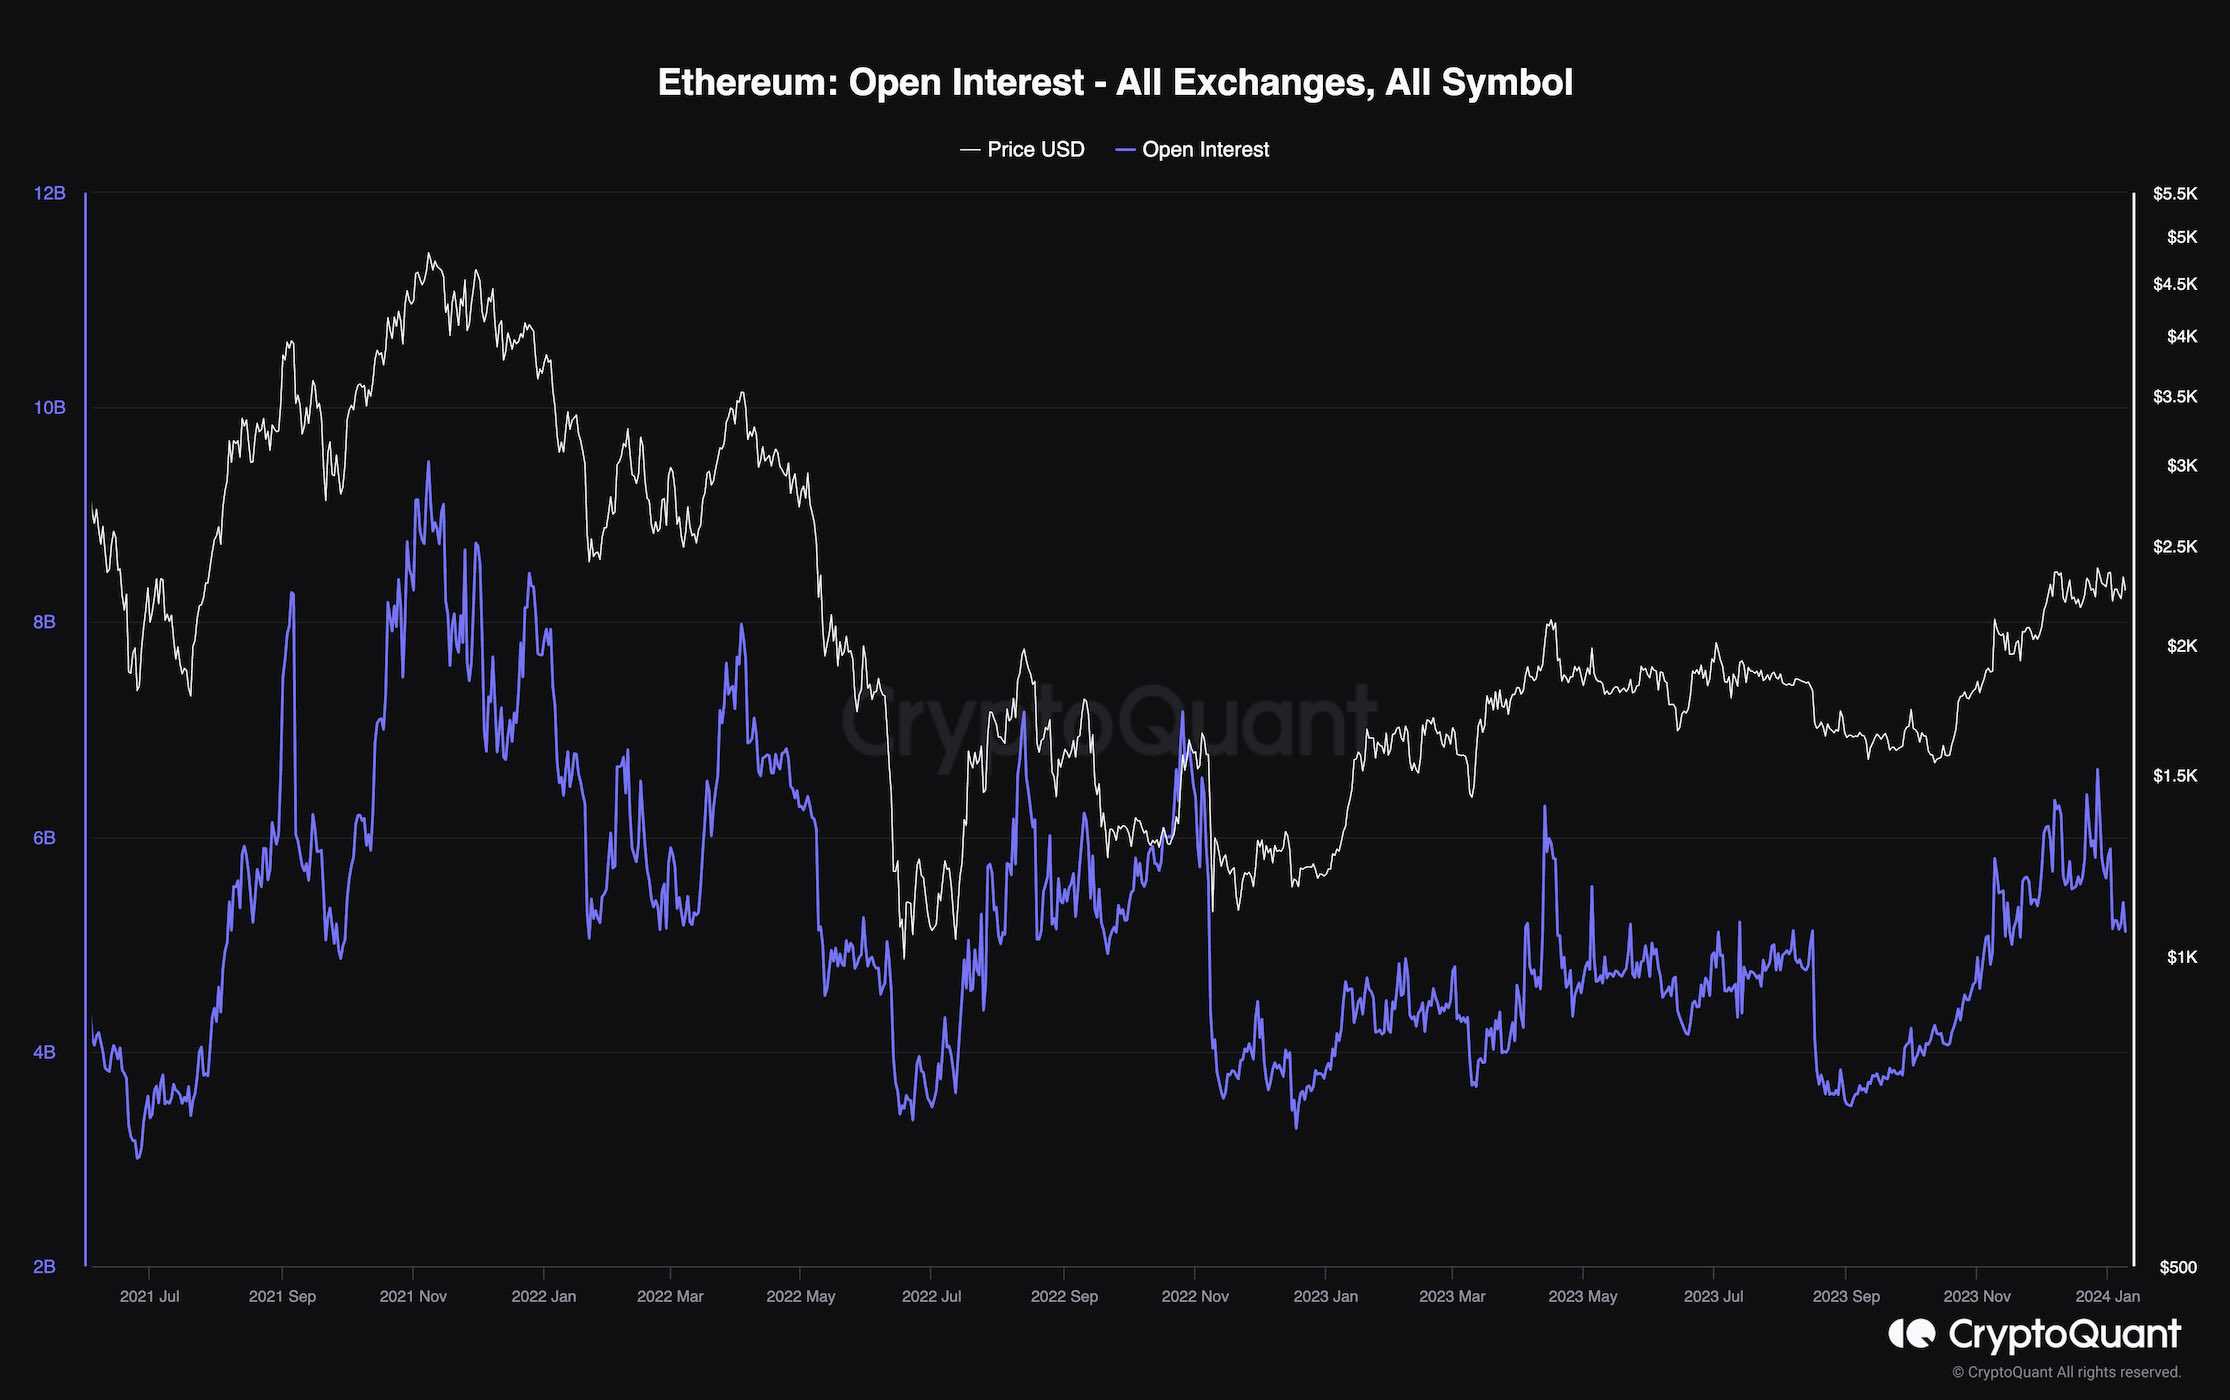
Ethereum Open Interest
While Ethereum’s price has been going through a consolidation phase, the underlying dynamics of the futures market are displaying an interesting sign.
This chart demonstrates open interest, which is one of the most essential metrics for future market sentiment evaluation. It measures the number of open futures positions. Higher values are typically associated with higher volatility and vice versa.
It is evident that while the price has been moving in a tight range recently, the open interest has dropped considerably. A significant decline in open interest without a price plunge is considered a bullish signal, as it hints at the fact that the futures market is not overheated anymore, and the price can continue its gradual uptrend in the coming weeks.
The post Ethereum Tests $2.4K as Bulls Look to Finally Take Control: ETH Price Analysis appeared first on CryptoPotato.