Calm Before the Storm? XRP Looking Primed for Big Move But Which Way? (Ripple Price Analysis)
Ripple has recently faced heightened selling pressure, propelling the price below a crucial support region that includes the wedge’s lower boundary and the 100-day and 200-day moving averages.
However, a completed pullback has recently emerged, confirming the validity of the breakout.
XRP Analysis
By Shayan
The Daily Chart
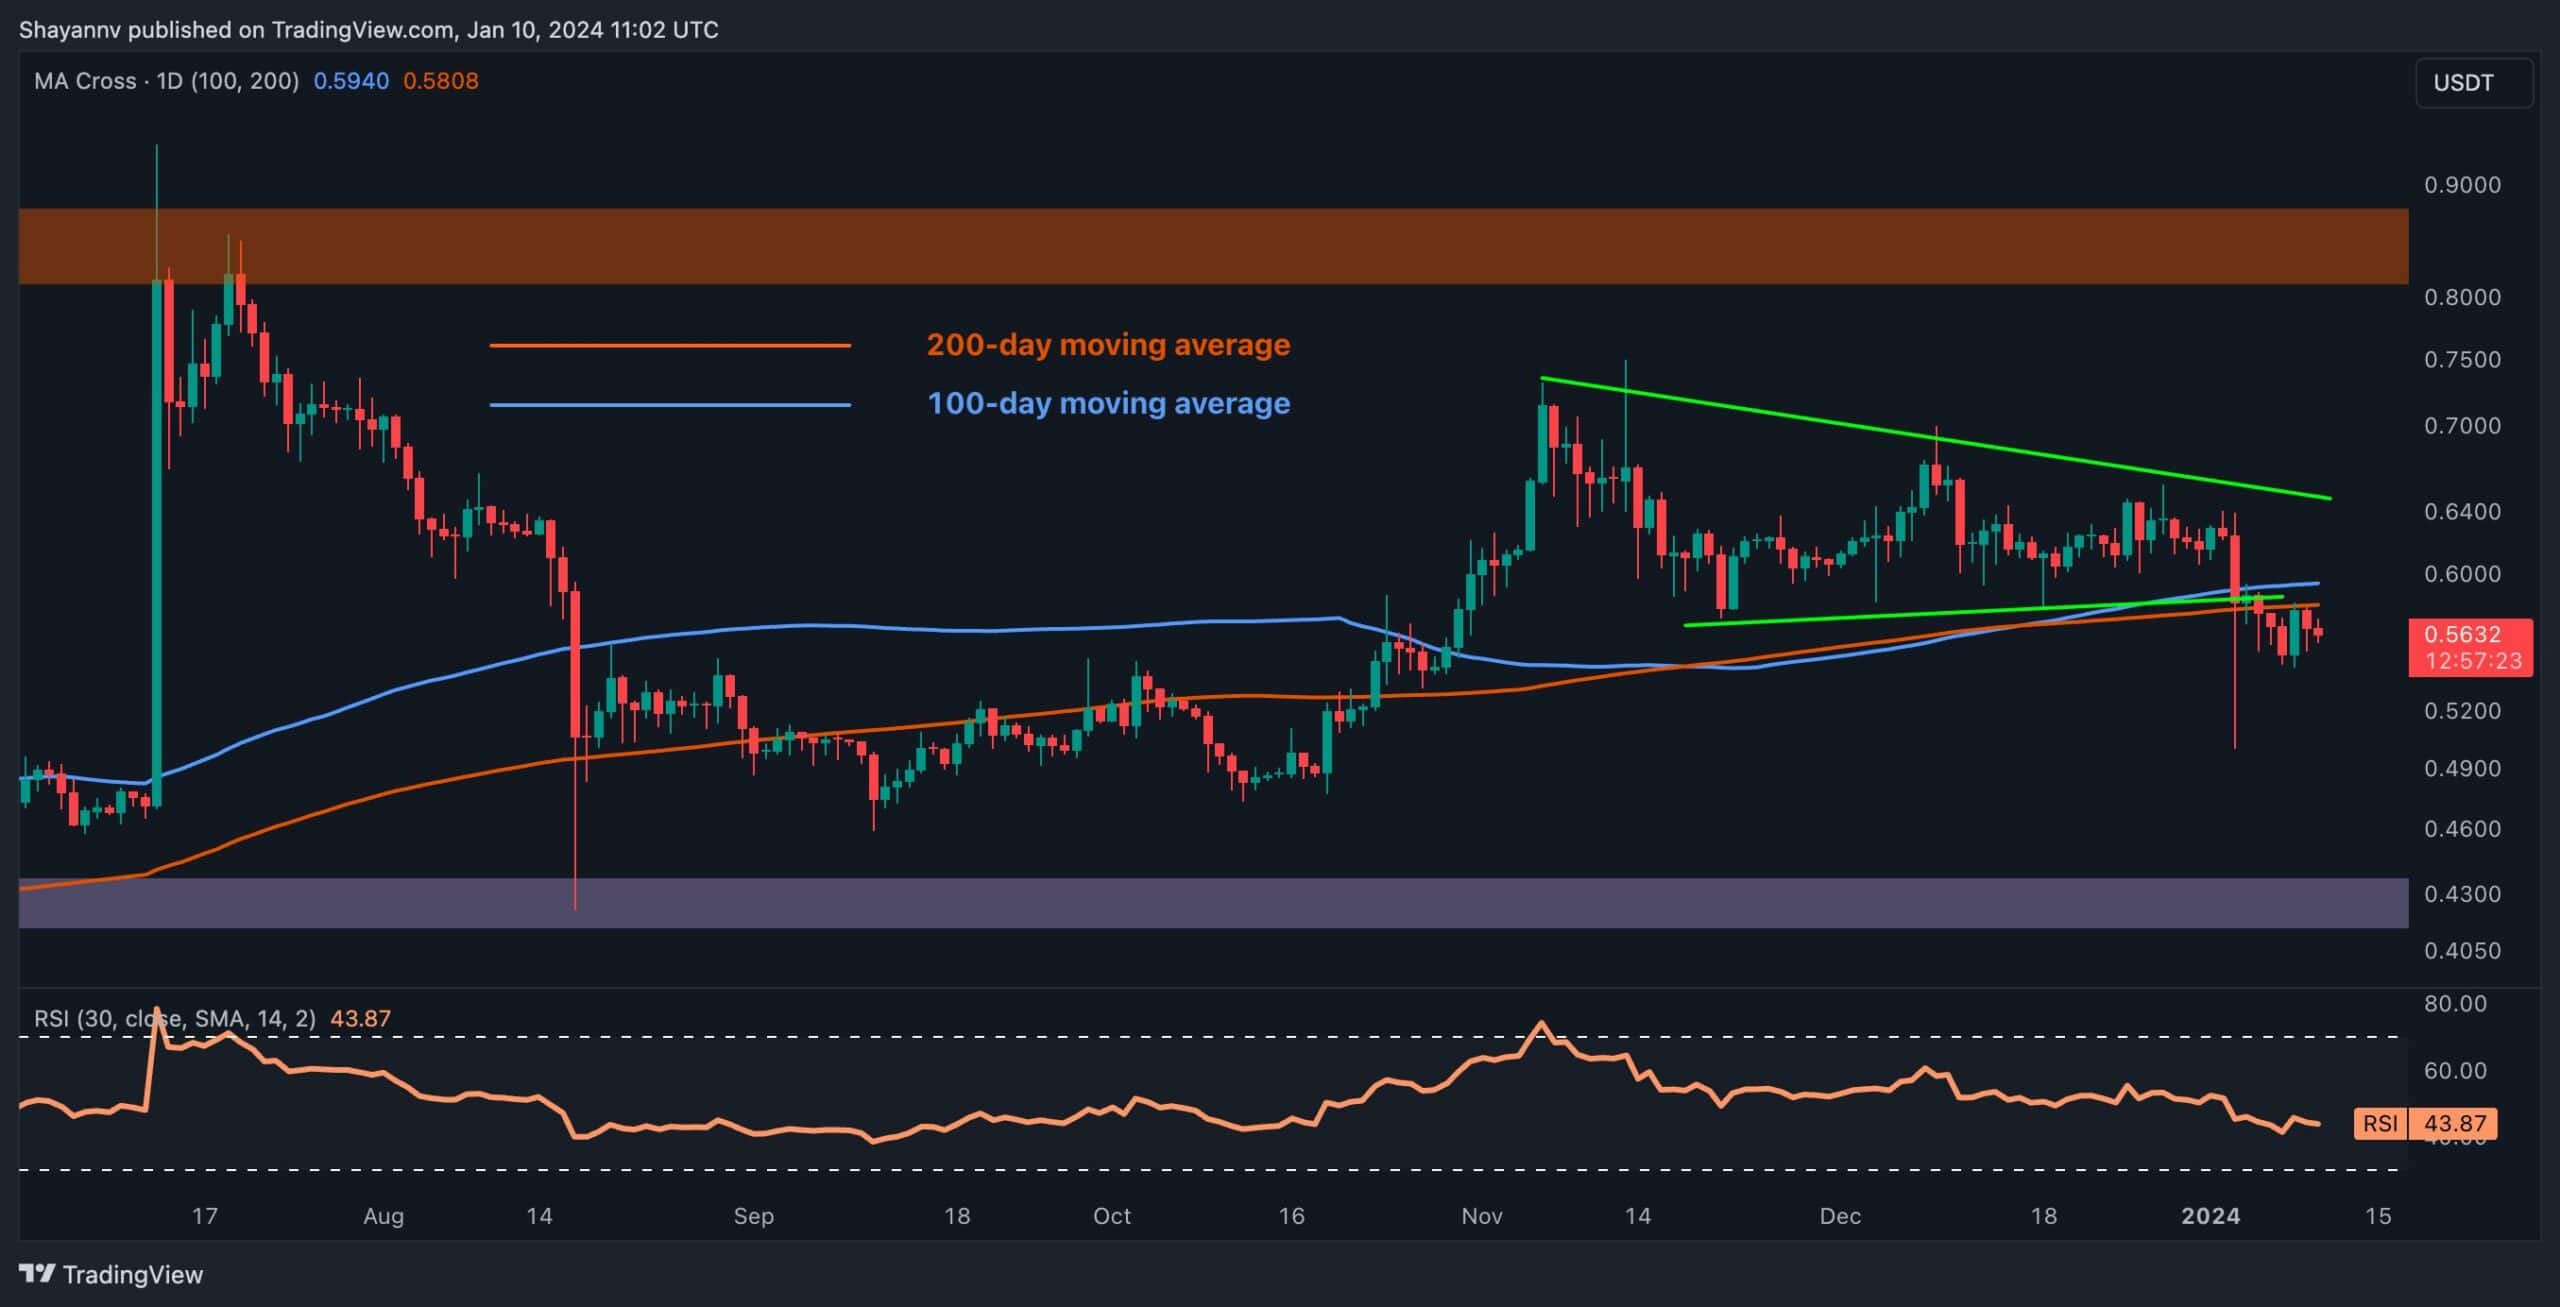
The daily chart reveals a pronounced drop in Ripple’s price, breaching its multi-month sideways consolidation range. This occurrence initiated a substantial number of sell-stop orders, intensifying selling pressure and pushing the price below a crucial support area. This support area encompasses the 100-day and 200-day moving averages, along with the lower boundary of the wedge.
Despite this, the cryptocurrency found support at the $0.499 threshold and retraced back to the breached level, completing a pullback. This successful pullback suggests a valid breakout, hinting at the possibility of a mid-term downward trend toward the substantial $0.48 support region.
The 4-Hour Chart
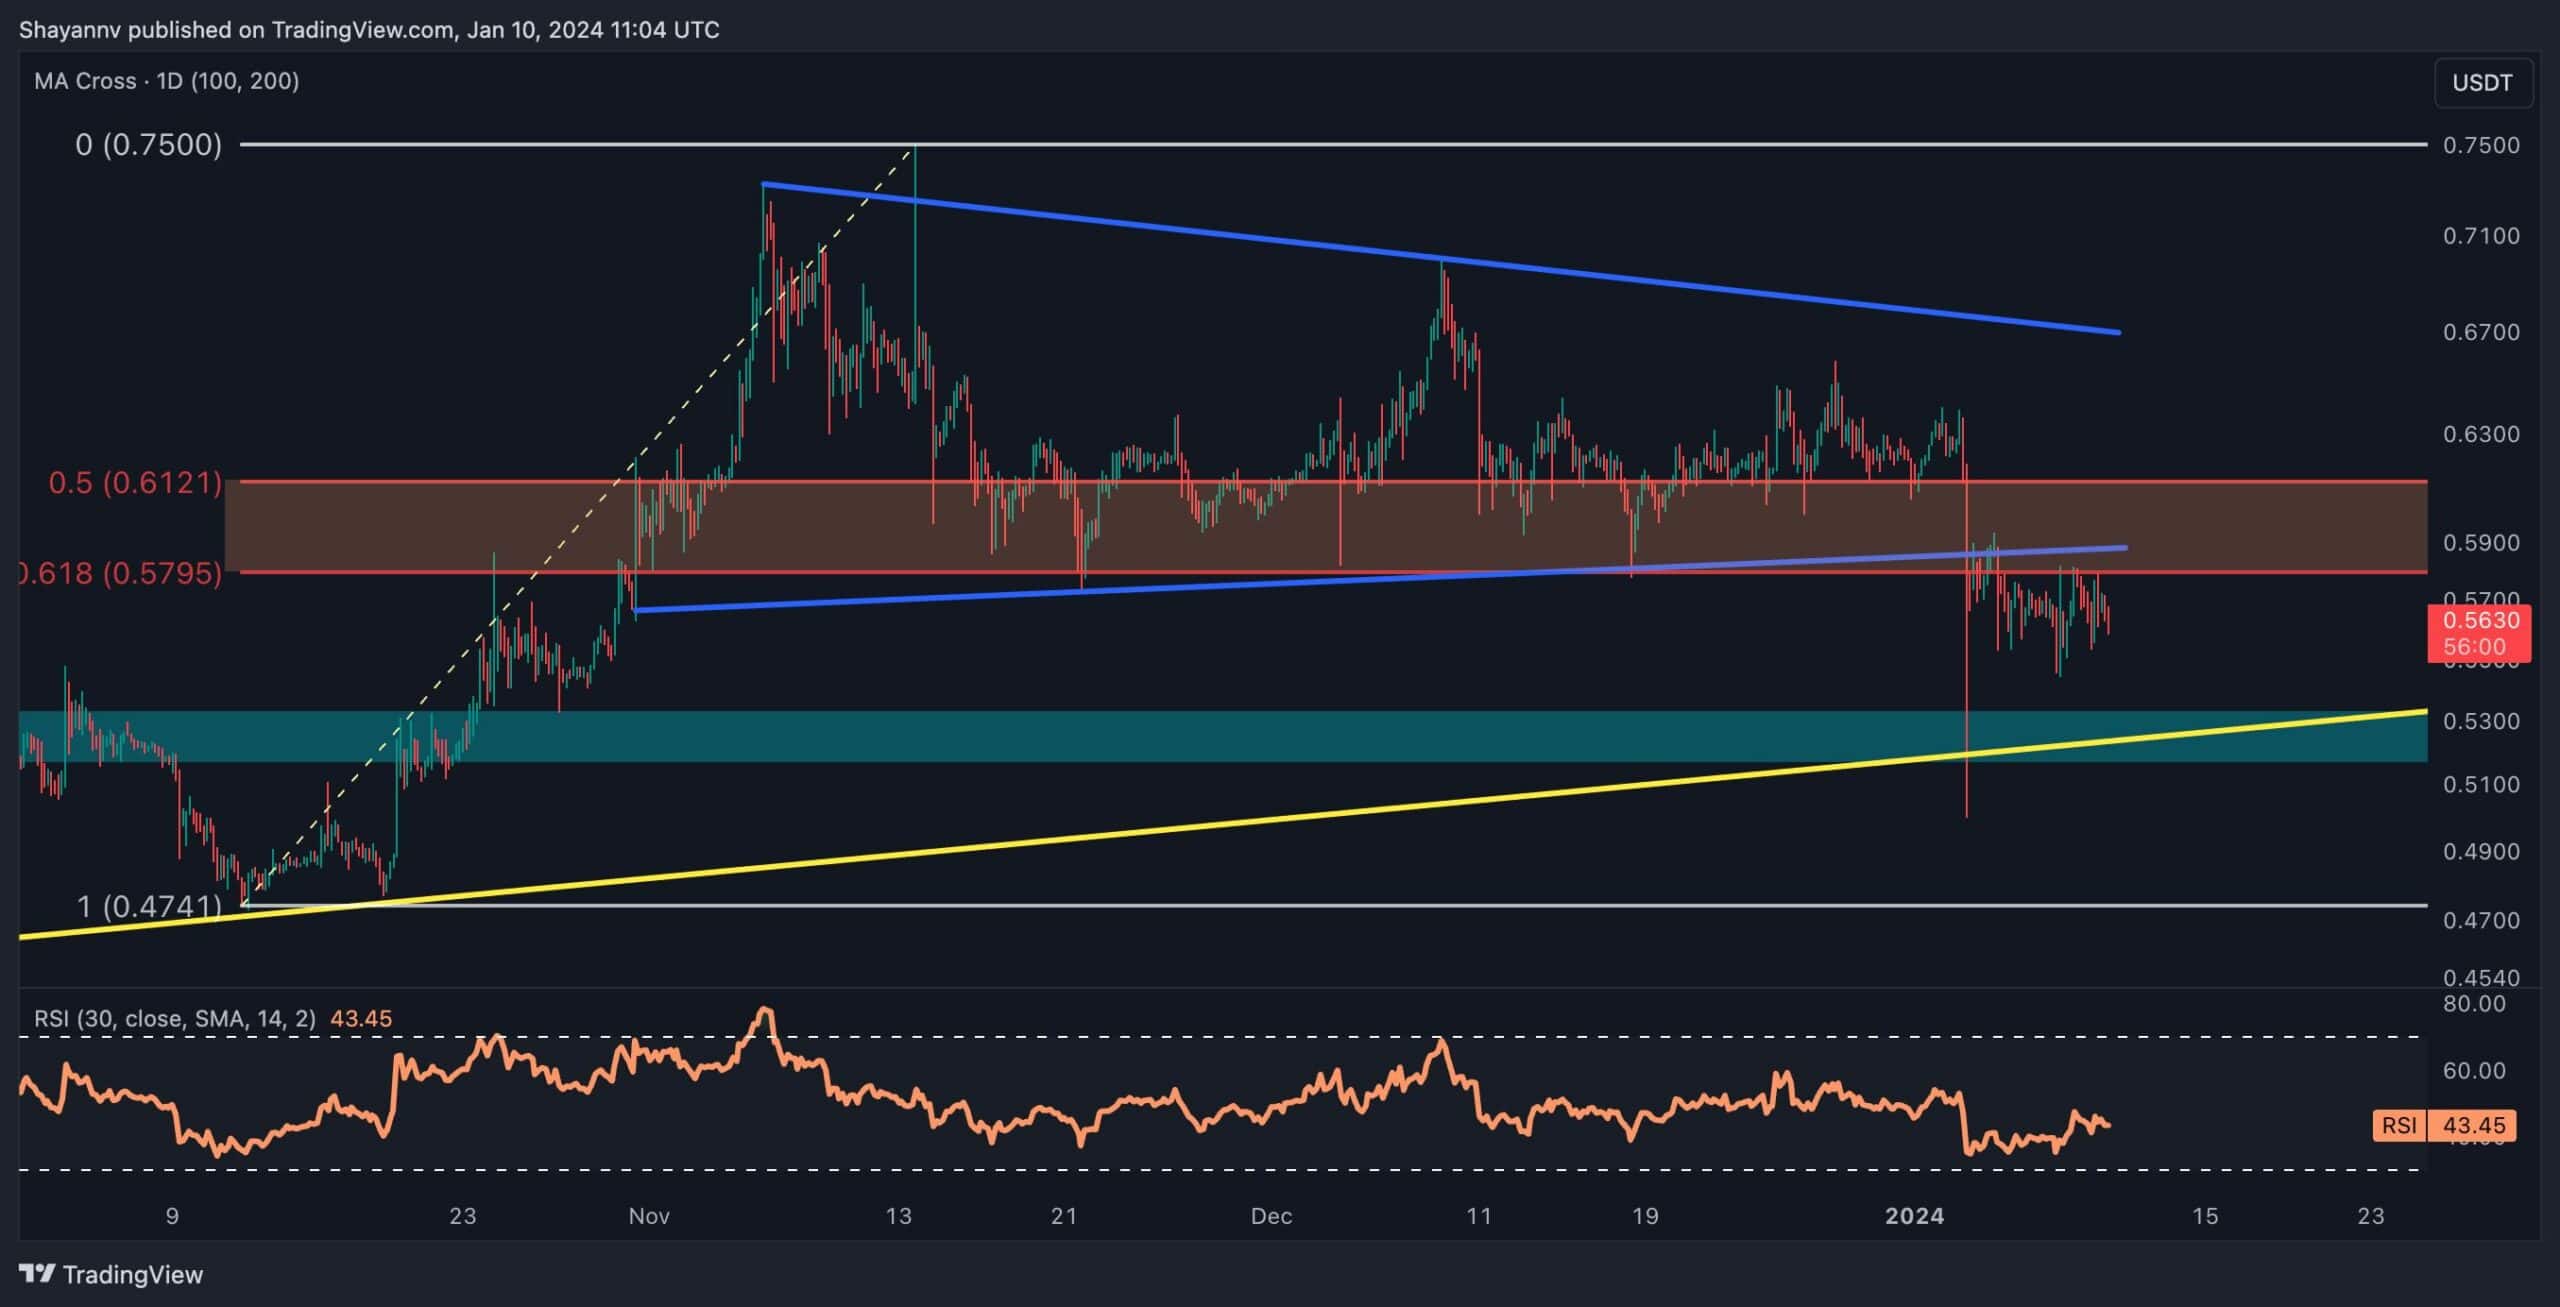
A closer examination of the 4-hour chart reveals an impulsive breach below a significant support region, spanning from the critical 0.5 ($0.61) to 0.618 ($0.58) levels of the Fibonacci retracement, aligning with the lower boundary of the wedge. However, sellers encountered increased demand around the crucial $0.499 region and the multi-month ascending trendline, leading to a retracement back toward the breached support region.
Ripple seems to be contained within a tight dynamic range, defined by the resistance region marked by the critical 0.5 ($0.61) to 0.618 ($0.58) Fibonacci retracement levels and the crucial dynamic support of the ascending trendline. Consequently, a mid-term consolidation stage within this pivotal range is anticipated for Ripple until a valid breakout occurs in either direction.
The post Calm Before the Storm? XRP Looking Primed for Big Move But Which Way? (Ripple Price Analysis) appeared first on CryptoPotato.