Let’s start with a quick overview of the Bitcoin chart; Yesterday the bulls attempted to break up the descending trend-line resistance. This attempt had failed, and at the moment BTC is back at below the descending trend-line, whereas the support is around $3420.
ETH had followed the same pattern, despite that in the ETH scenario, the correction since January 5 didn’t form a descending trend-line like in BTC.
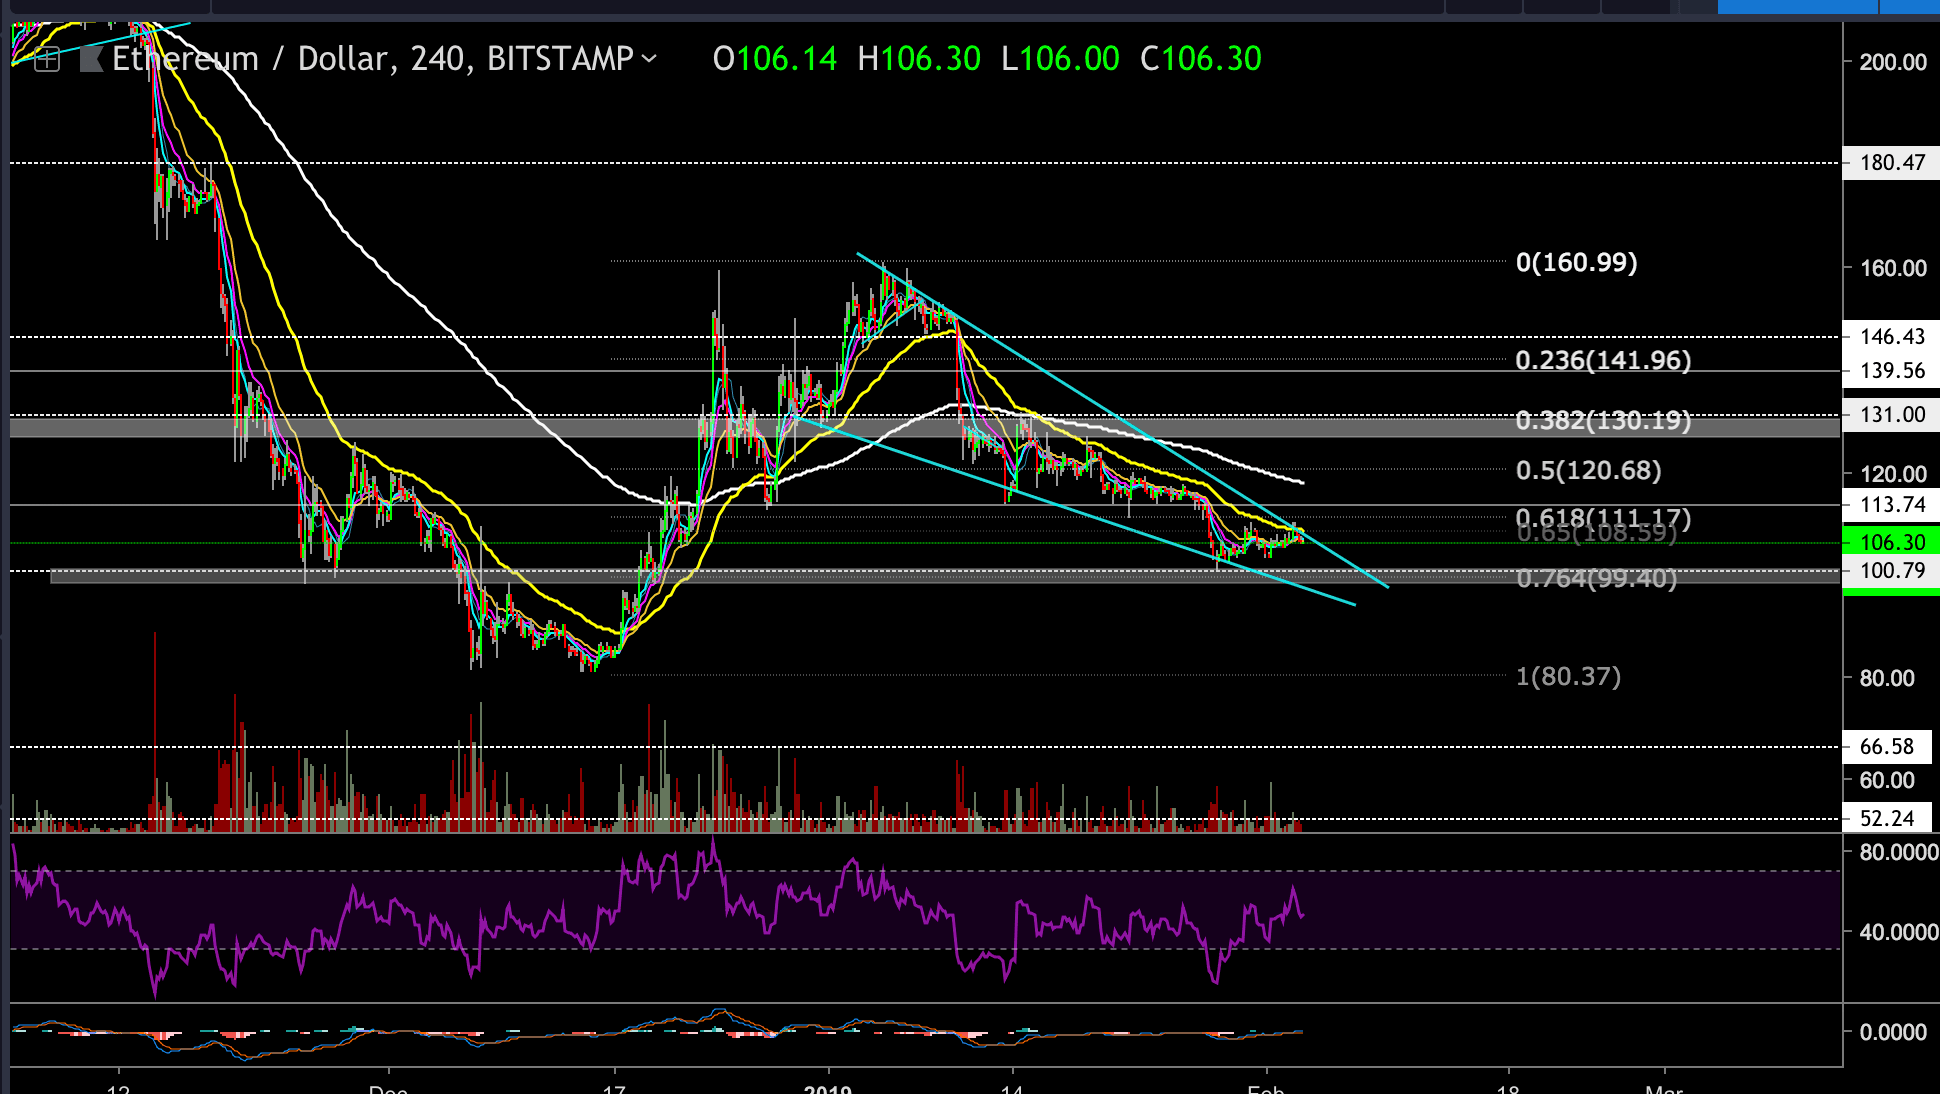
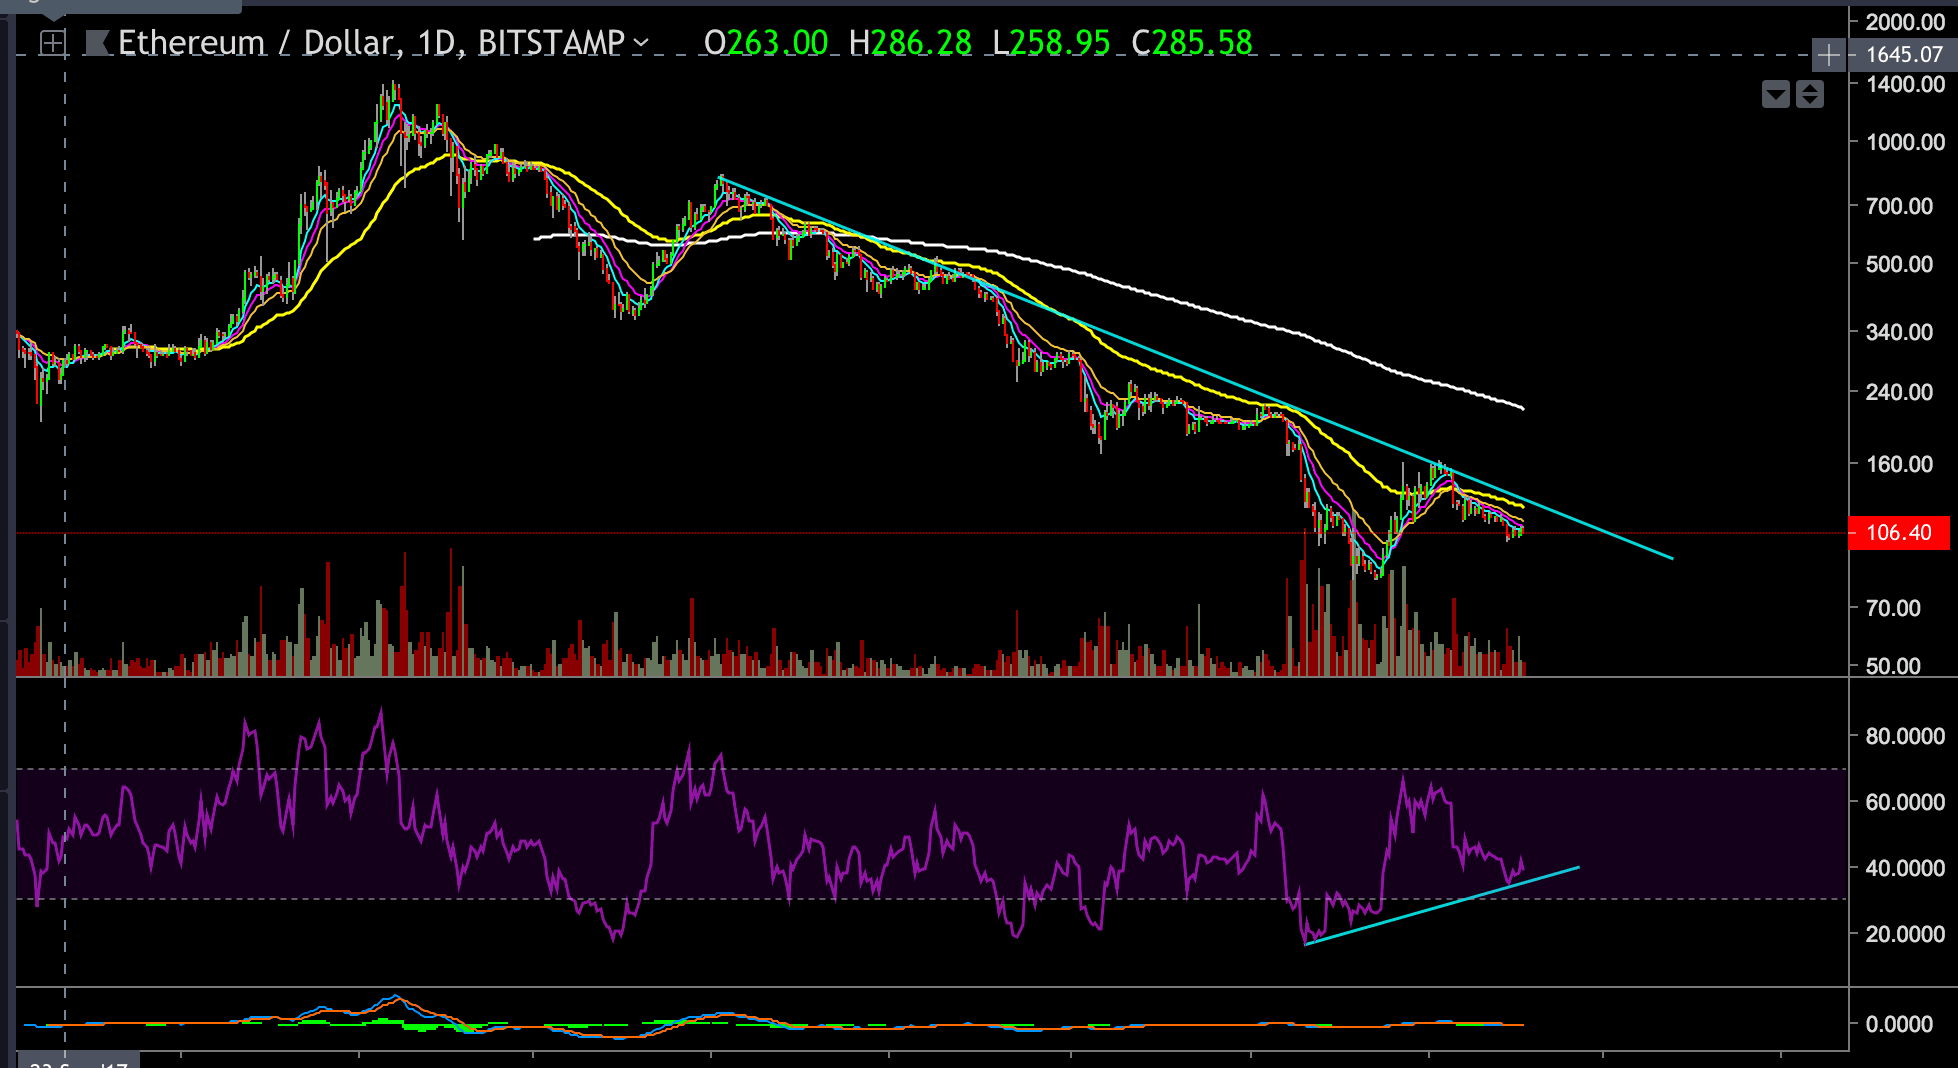
Looking at the 4-hour and 1-day ETH-USD chart
- At the moment ETH is trading around the $107 price level.
- ETH had failed to breach the descending trend line that serves as a resistance level and is currently trading between the resistance and support trend lines.
- This failure will probably result in a retest of the lower trend line around the $100 price level or even lower. This level is also a support level from the daily chart at $100-$98 (marked by a grey area on the following chart)
- Looking at the daily chart, we can notice that the volume is continuously decreasing toward the apex of the support and resistance trend lines, and sooner or later there will have to be a decision to either direction.
- In the case of a breakdown, below the supporting trend-line, ETH is very likely to retest the prior low at $80-$85.
- On the other hand, if the bulls will show some strength and trigger a mini-rally upside, ETH could retest the $114 resistance level or even higher – toward the $126 resistance.
- ETH is trading between the 0.618 – 0.764 Fibonacci retracement levels and the bulls would like to see a significant move developing from those levels to the bullish side. Till then, our targets are bearish.
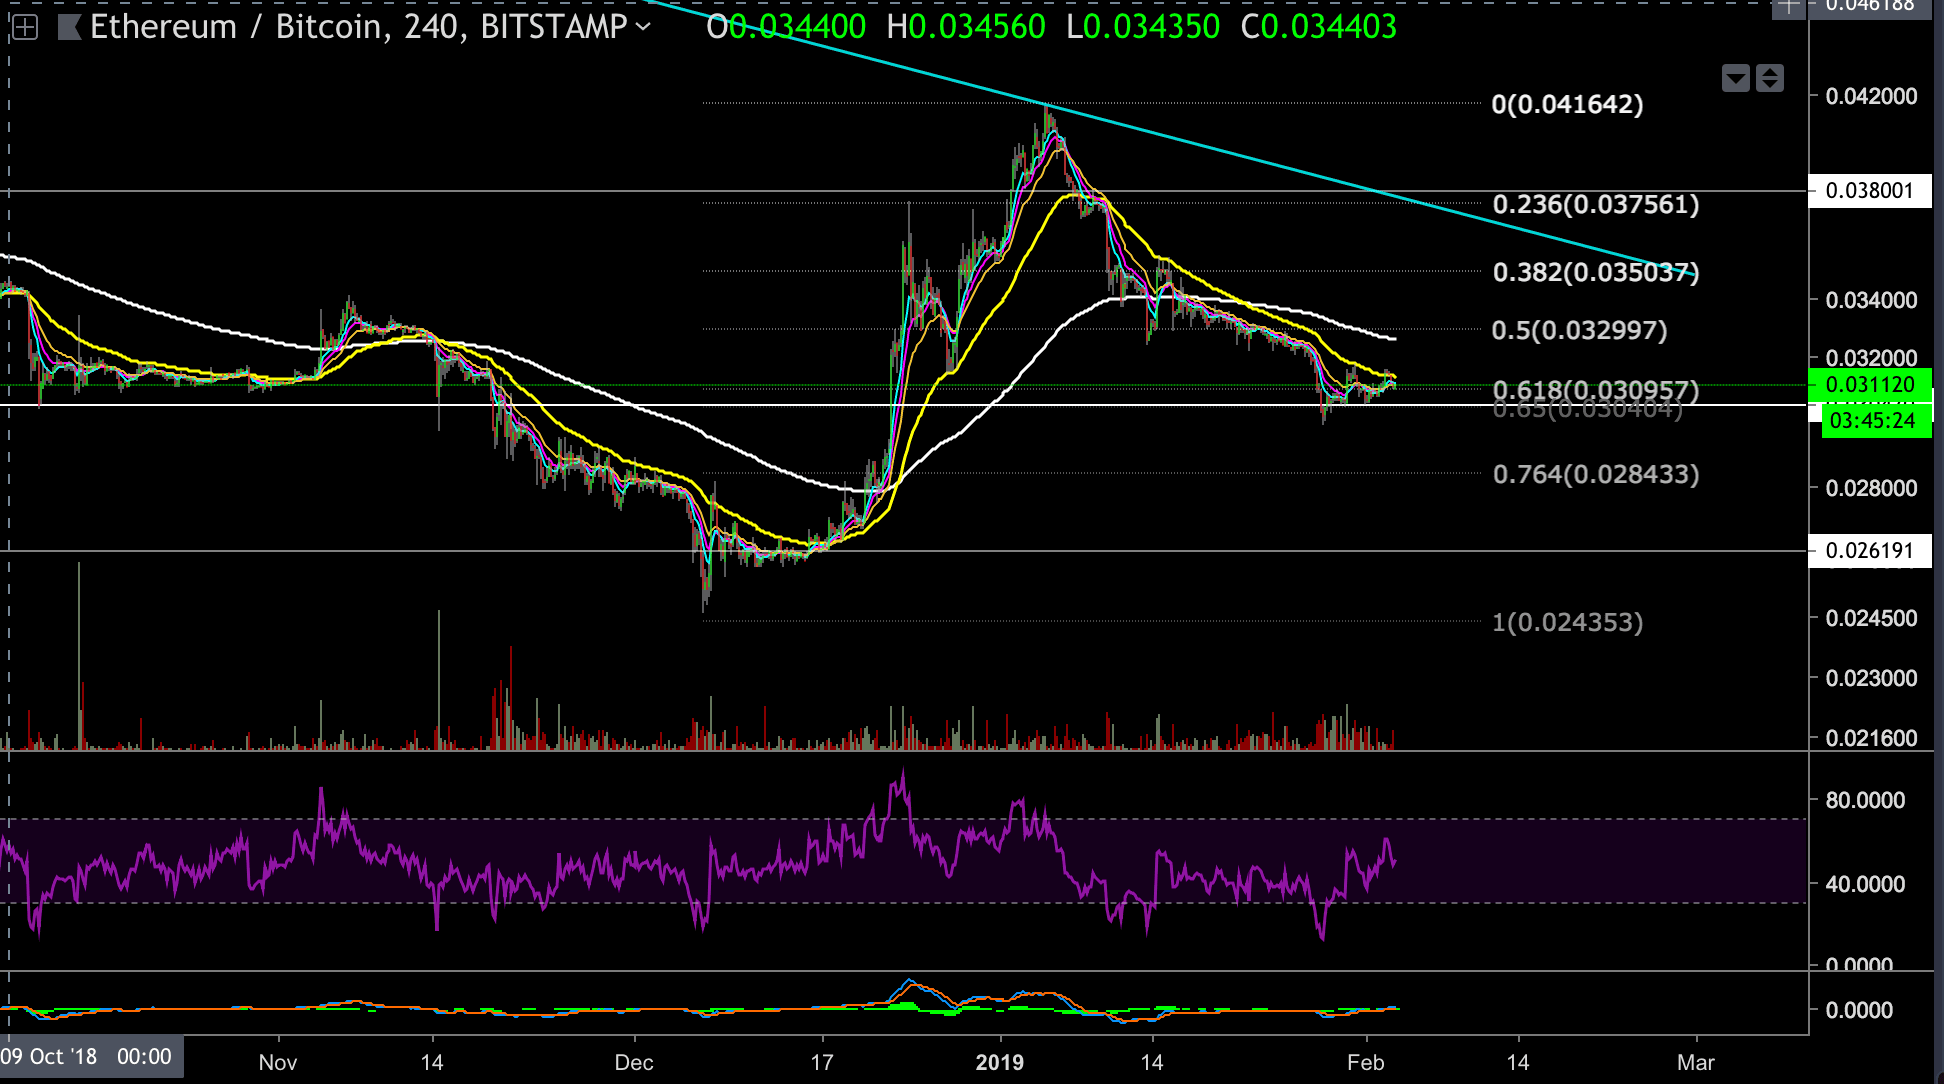
Looking at the ETH-BTC 4 hours chart
- ETH is still holding the 0.618 Fibonacci retracement level.
- The 55 EMA and 200 EMA (yellow and white lines) act as resistance levels.
- The 0.0305 BTC support still holds up. We would like to see a bullish reversal from this level, but as of now, nothing is definite.
The post Ethereum Price Analysis Feb.3: ETH Follows BTC By Failing to Break The Descending Trend-line. $100 Soon? appeared first on CryptoPotato.