Bitcoin Price Analysis Feb.3: BTC Faces Down Following Rejection Of The $3480 Mid-Term Trend-Line
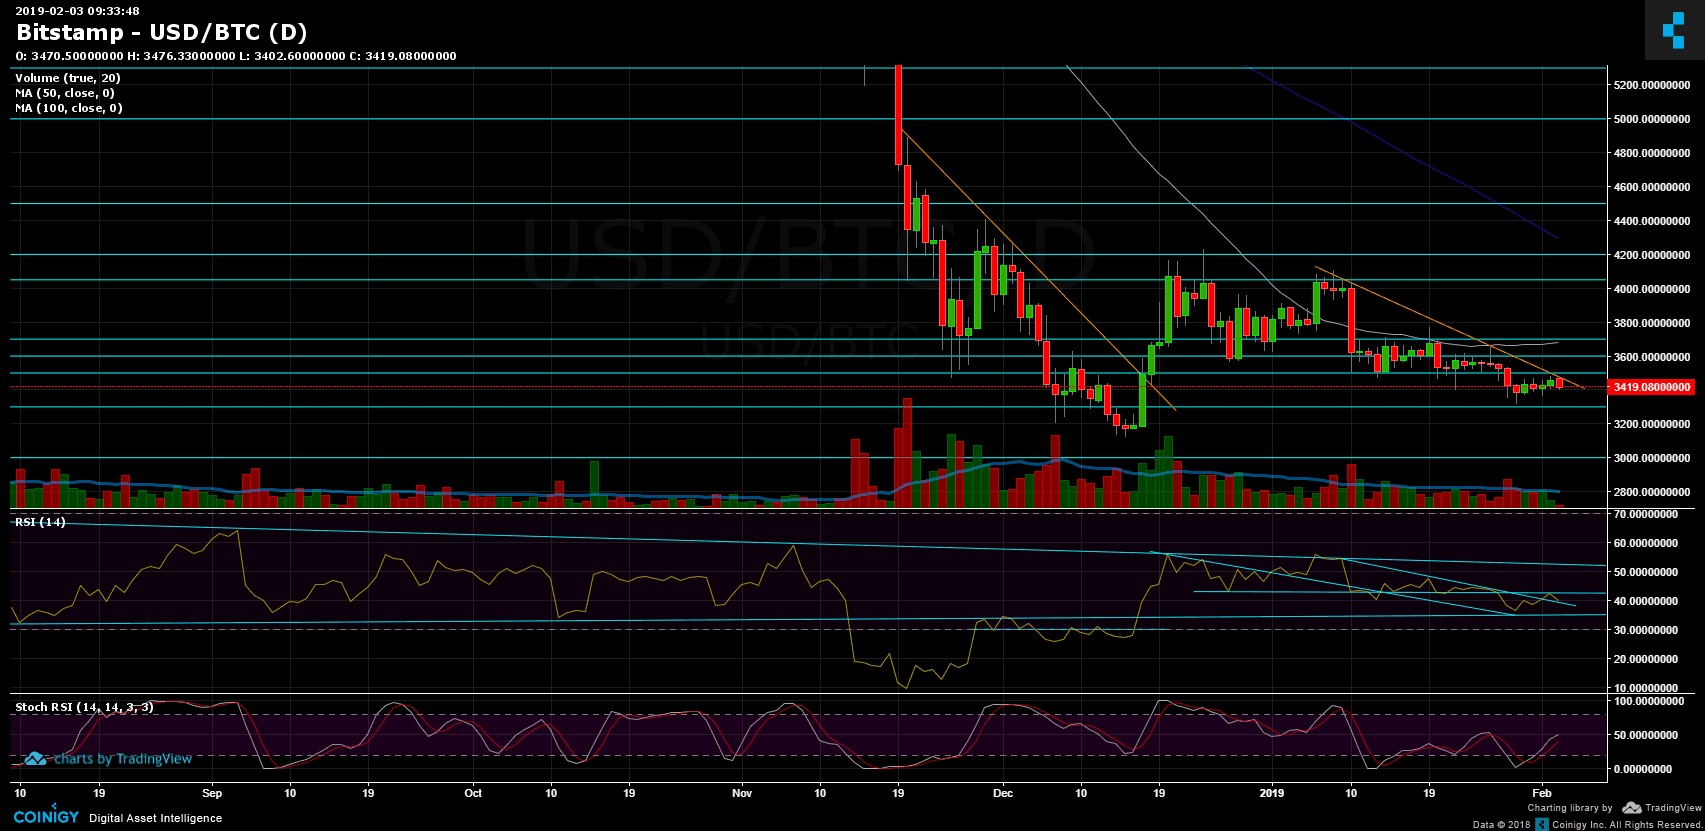
Not much had changed since our previous Bitcoin price analysis. The bottom line is that Bitcoin is consolidating around the $3400 support range, failing to break-up the month-long descending trend-line (can be seen on the following daily chart).
We’ve also mentioned the possibility that Bitcoin will retest the $3480 – $3500 significant resistance area, which just happened during the recent hours.
Looking at the 1-day & 4-hour charts
- Let’s start from the bigger picture of the current Bitcoin status: As can be seen on the daily chart, Bitcoin encountered, one more time, the descending trend-line and got rejected.
- The RSI also rejected by the 43 RSI’s resistance level. As of now, the RSI is testing the descending trend-line as support. This, along with $3400, can support a bit. However, as said here before, seems like Bitcoin targets for lower and no buyers are yet to show up.
- From below, in case of breaking down $3400, the next support lies around $3360, before reaching to $3300. Below are $3200 support and 2018 lowest price of $3120.
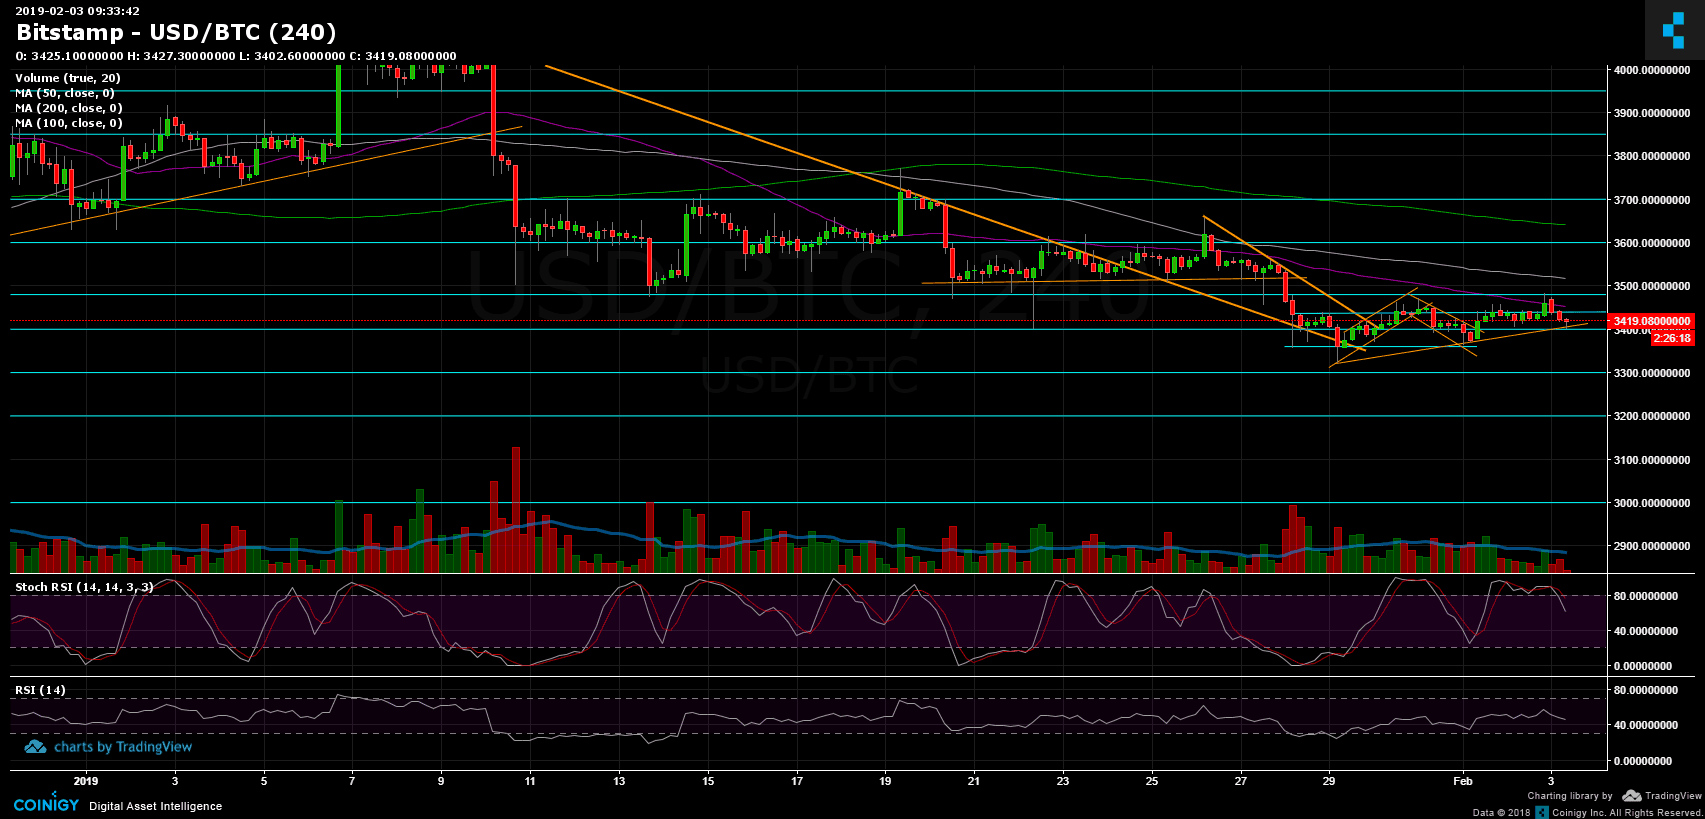
- From above, $3450 serves as the nearest resistance level (the 4-hour 50 days moving average line, marked in purple), before reaching to the significant $3480 – $3500 resistance area.
- Stochastic RSI of the 4-hour chart had crossed over on the overbought area; this also supports the possibility of a decline.
- The trading volume is not significant; this could be typical to weekends.
- BitFinex’s open short positions decreased to 24.8K BTC of open positions.
BTC/USD BitStamp 4-Hour chart
BTC/USD BitStamp 1-Day chart
The post Bitcoin Price Analysis Feb.3: BTC Faces Down Following Rejection Of The $3480 Mid-Term Trend-Line appeared first on CryptoPotato.