Ethereum Price Analysis: ETH Plotting a Huge Move Following Consolidation at $600
ETH/USD – Ethereum Consolidation Continues
Key Support Levels: $580, $560, $550.
Key Resistance Levels: $600, $620, $650.
Last week, Ethereum attempted to break the $620 level for the third time this year. Unfortunately, it was rejected again, which caused it to drop into the $560 support (.236 Fib) over the weekend.
The buyers rebounded from this support and started to push higher. Yesterday, the bulls reached the resistance at the upper boundary of a symmetrical triangle and are currently struggling to break above it.
The next direction for the market will be determined by the direction ETH breaks from the current consolidation pattern.
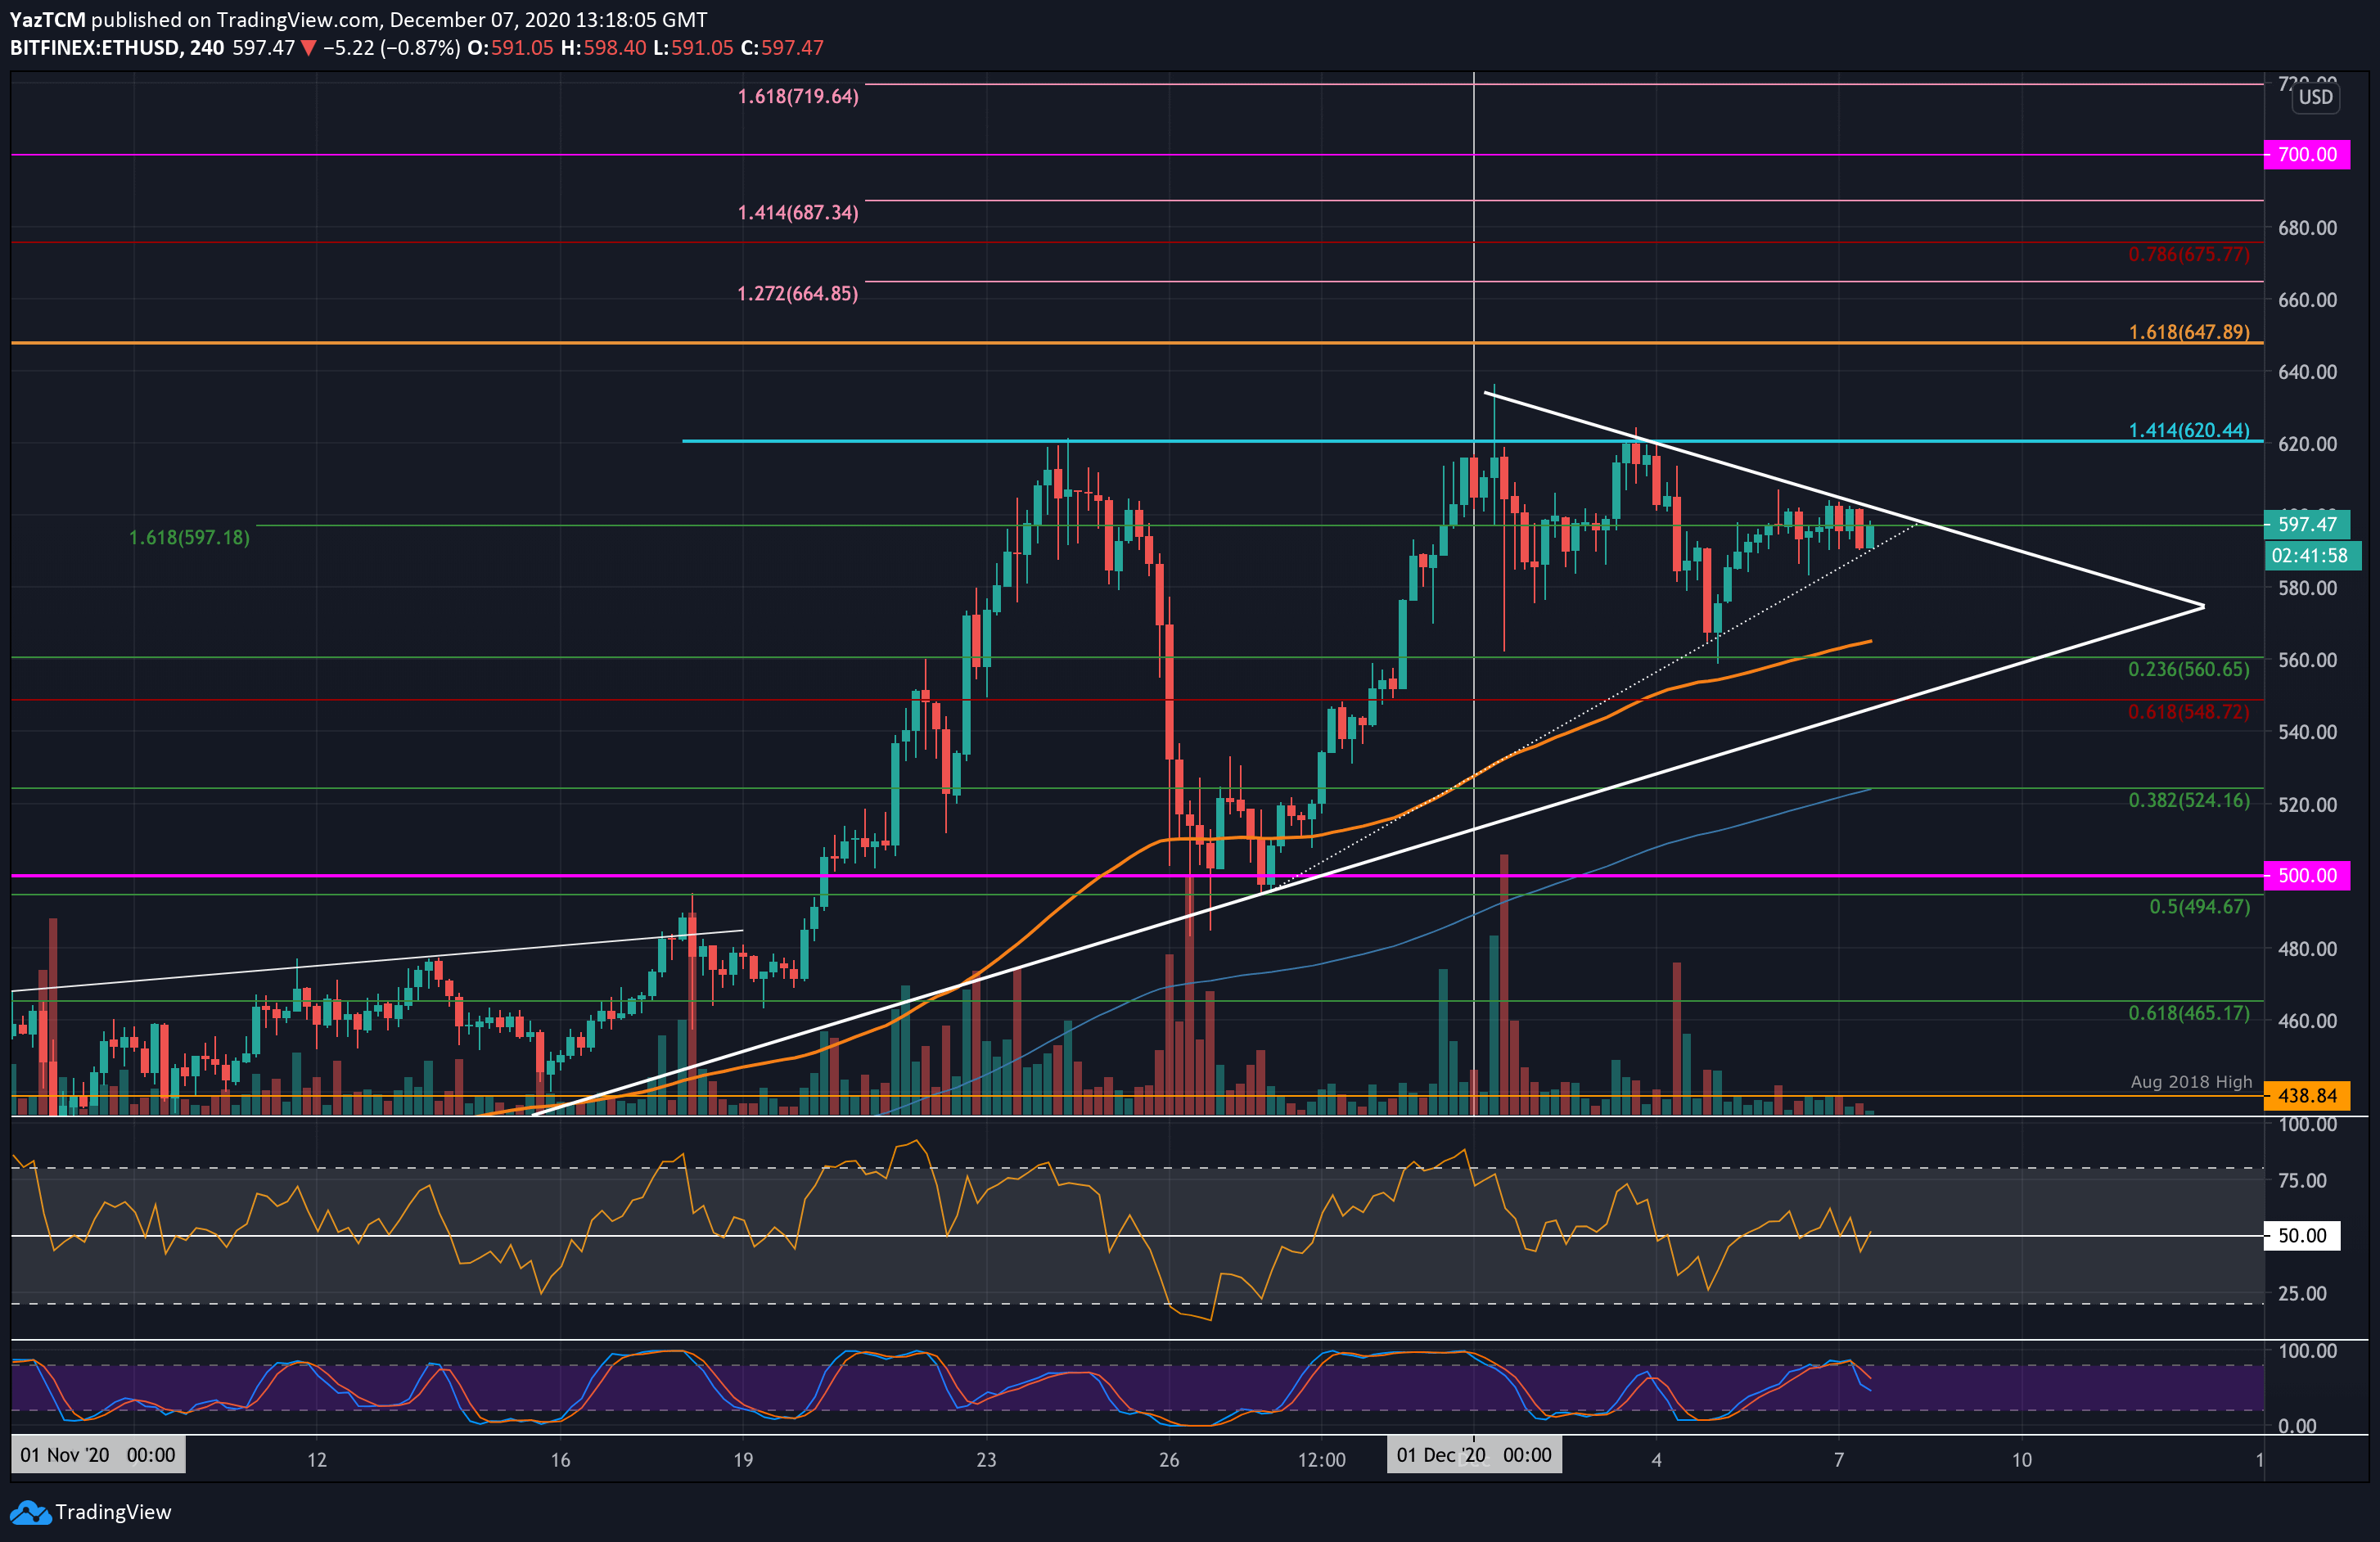
ETH-USD Short Term Price Prediction
Looking ahead, if the buyers break above $600 and penetrate above the upper boundary of the triangle, the first level of resistance lies at $620. This is followed by $650, $665, and $675 (bearish .786 Fib Retracement).
On the other side, the first level of support lies at $580. This is followed by support at $560 (.236 Fib), $550, the lower boundary of the triangle, and $525 (.382 Fib).
The 4HR Stochastic RSI recently produced a bearish crossover signal when the bulls met the resistance at the triangle’s upper boundary.
ETH/BTC – On the Verge of a Breakout
Key Support Levels: 0.0305 BTC, 0.03 BTC, 0.0291 BTC.
Key Resistance Levels: 0.0315 BTC, 0.032 BTC, 0.0325 BTC.
Ethereum is also trading within a symmetrical triangle pattern against Bitcoin and is very close to the apex where a breakout can be expected. The market has traded inside this triangle since the last week of November, and a breakout toward the upside should see ETH heading back to the 0.0337 BTC resistance.
As the market is so close to the apex, the breakout can be expected very soon.
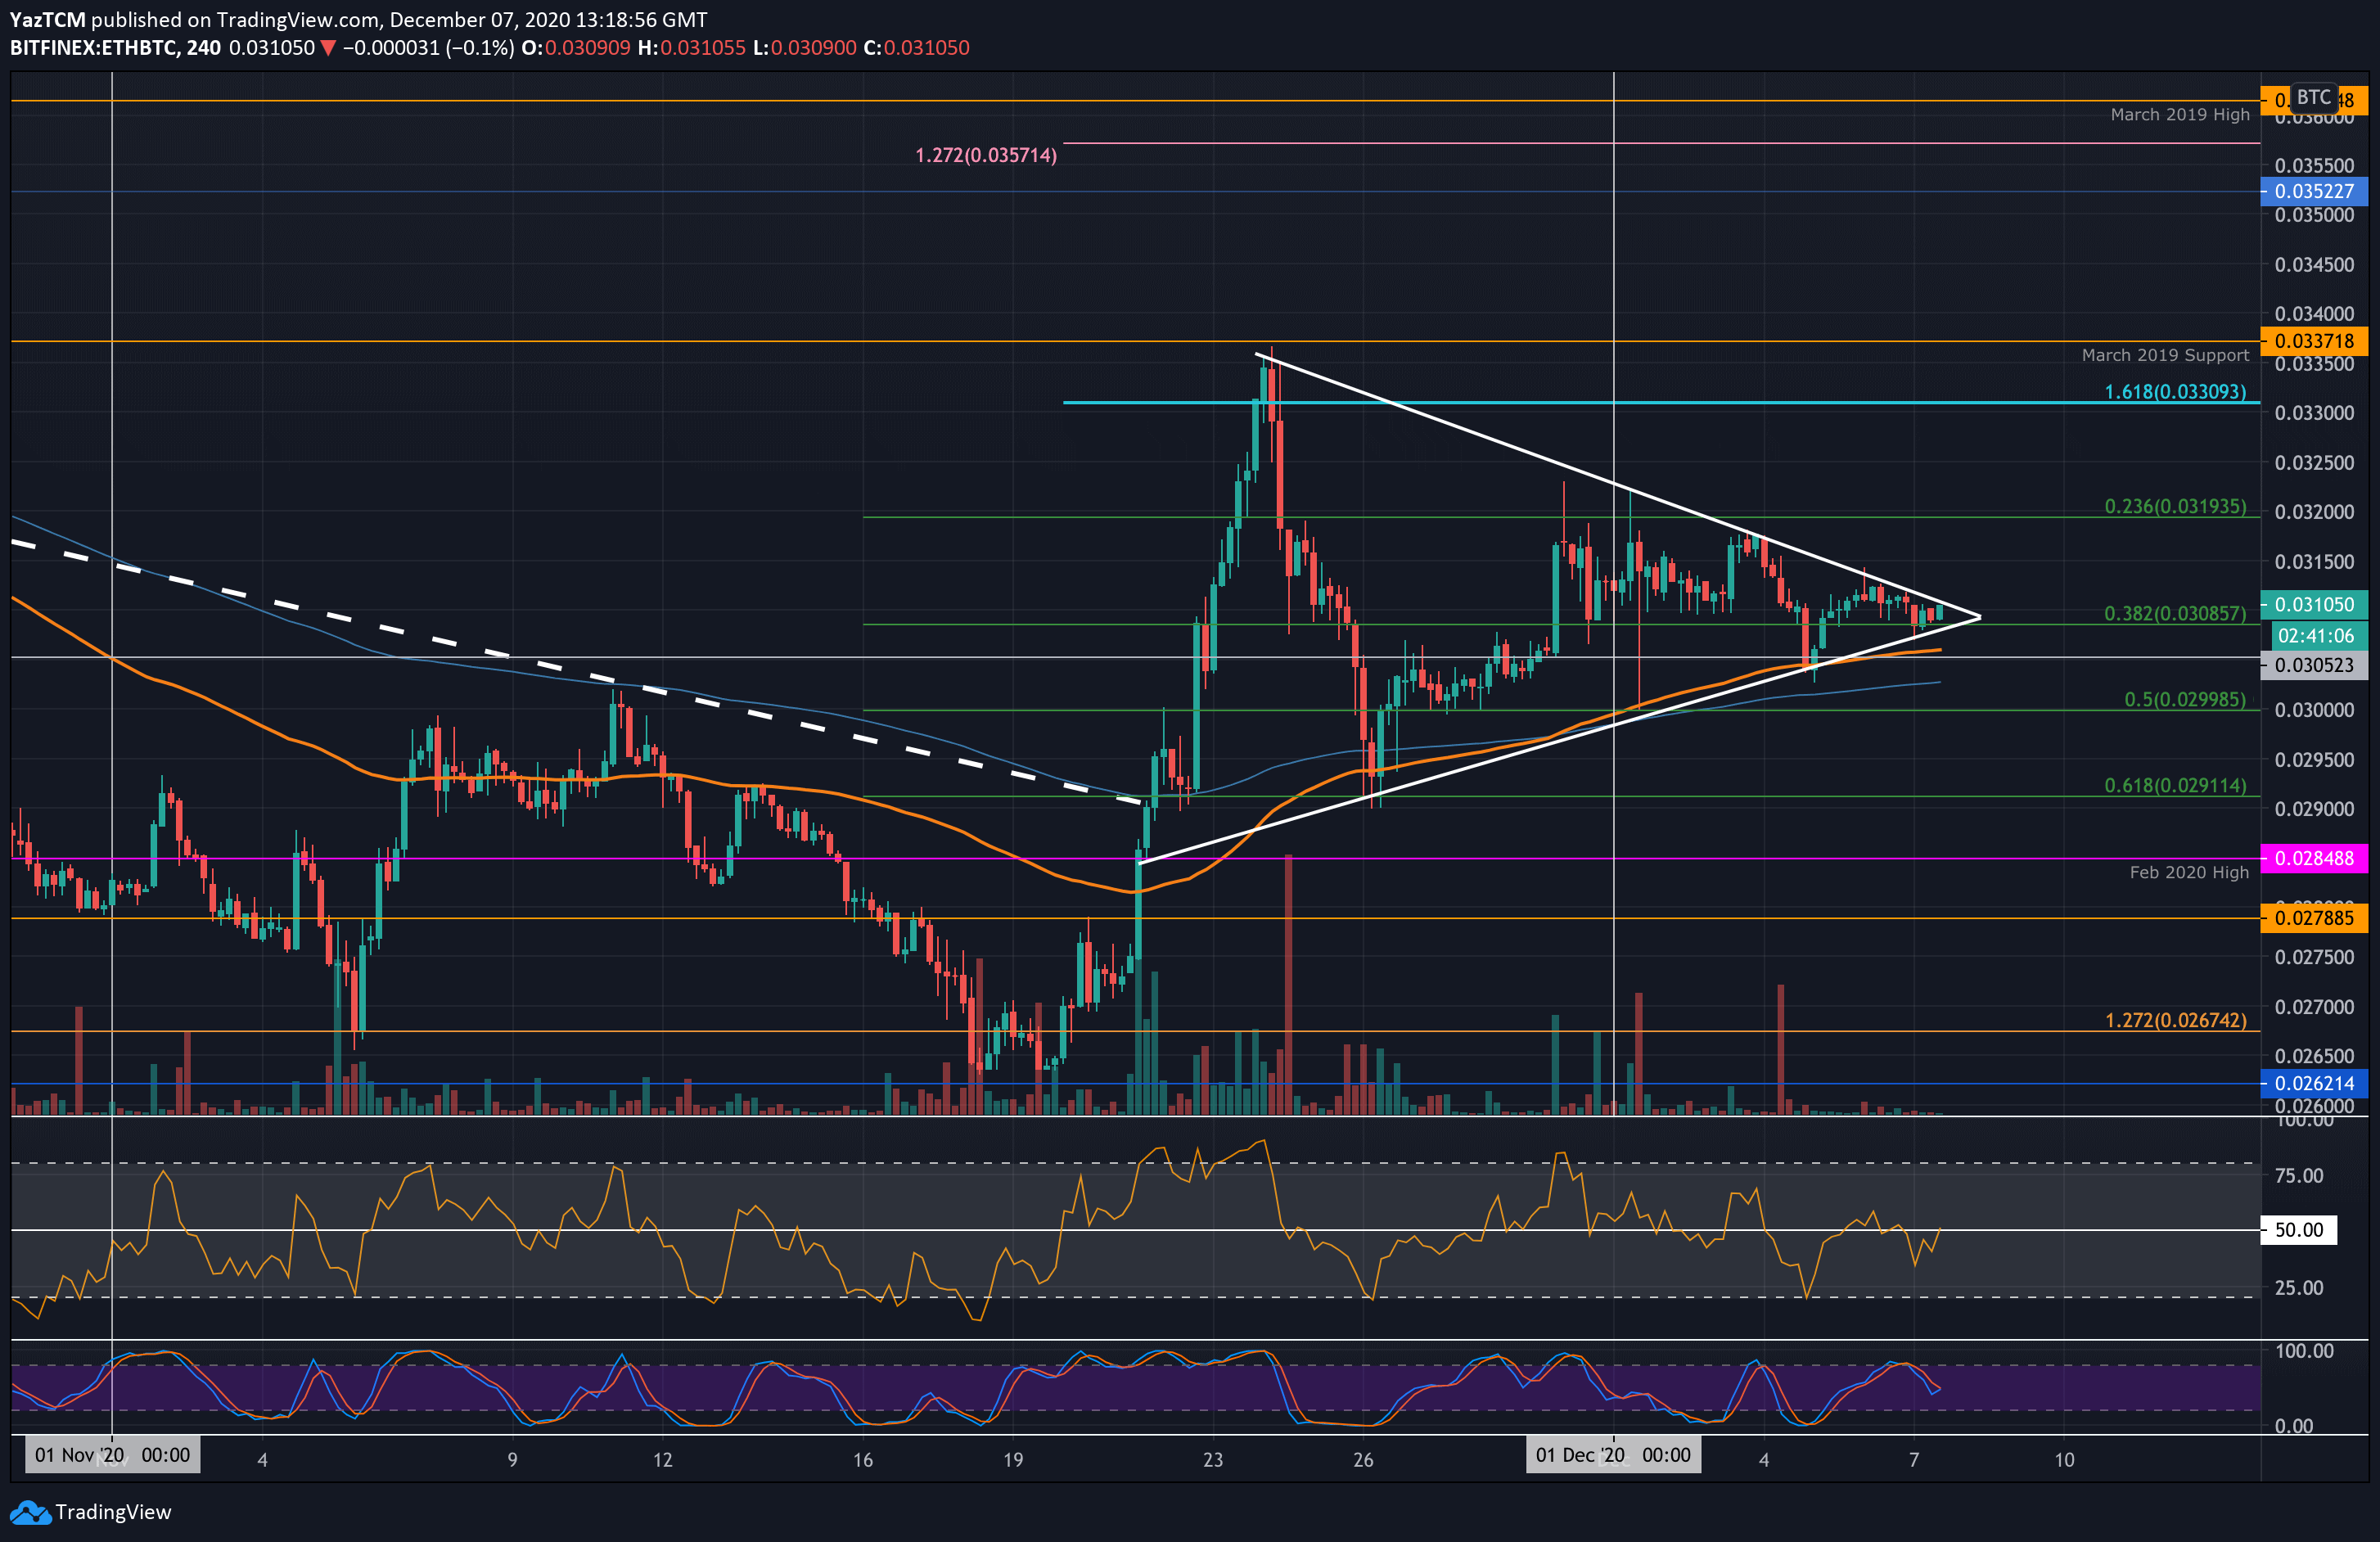
ETH-BTC Short Term Price Prediction
Looking ahead, if the bulls break above the triangle, the first level of resistance lies at 0.0315 BTC. This is followed by 0.032 BTC, 0.0325 BTC, and 0.033 BTC. Added resistance is then found at 0.0337 BTC (March 2019 Support).
On the other side, if the sellers break beneath the triangle, support lies at 0.0305 BTC, 0.03 BTC (.5 Fib), and 0.0291 BTC (.618 Fib).
The 4HR RSI is battling to break the mid-line to allow the buyers to take control of the market momentum.