BTC Price Rally to $40K or Correction to $31K Next? (Bitcoin Price Analysis)
Technical Analysis
By Shayan
Bitcoin’s recent market shifting indicates a strong presence of buyers, signaling a potential bullish trend. However, given the rapid surge in price within a short period and the approach to a significant resistance area, a temporary correction phase in the market seems likely.
The Daily Chart
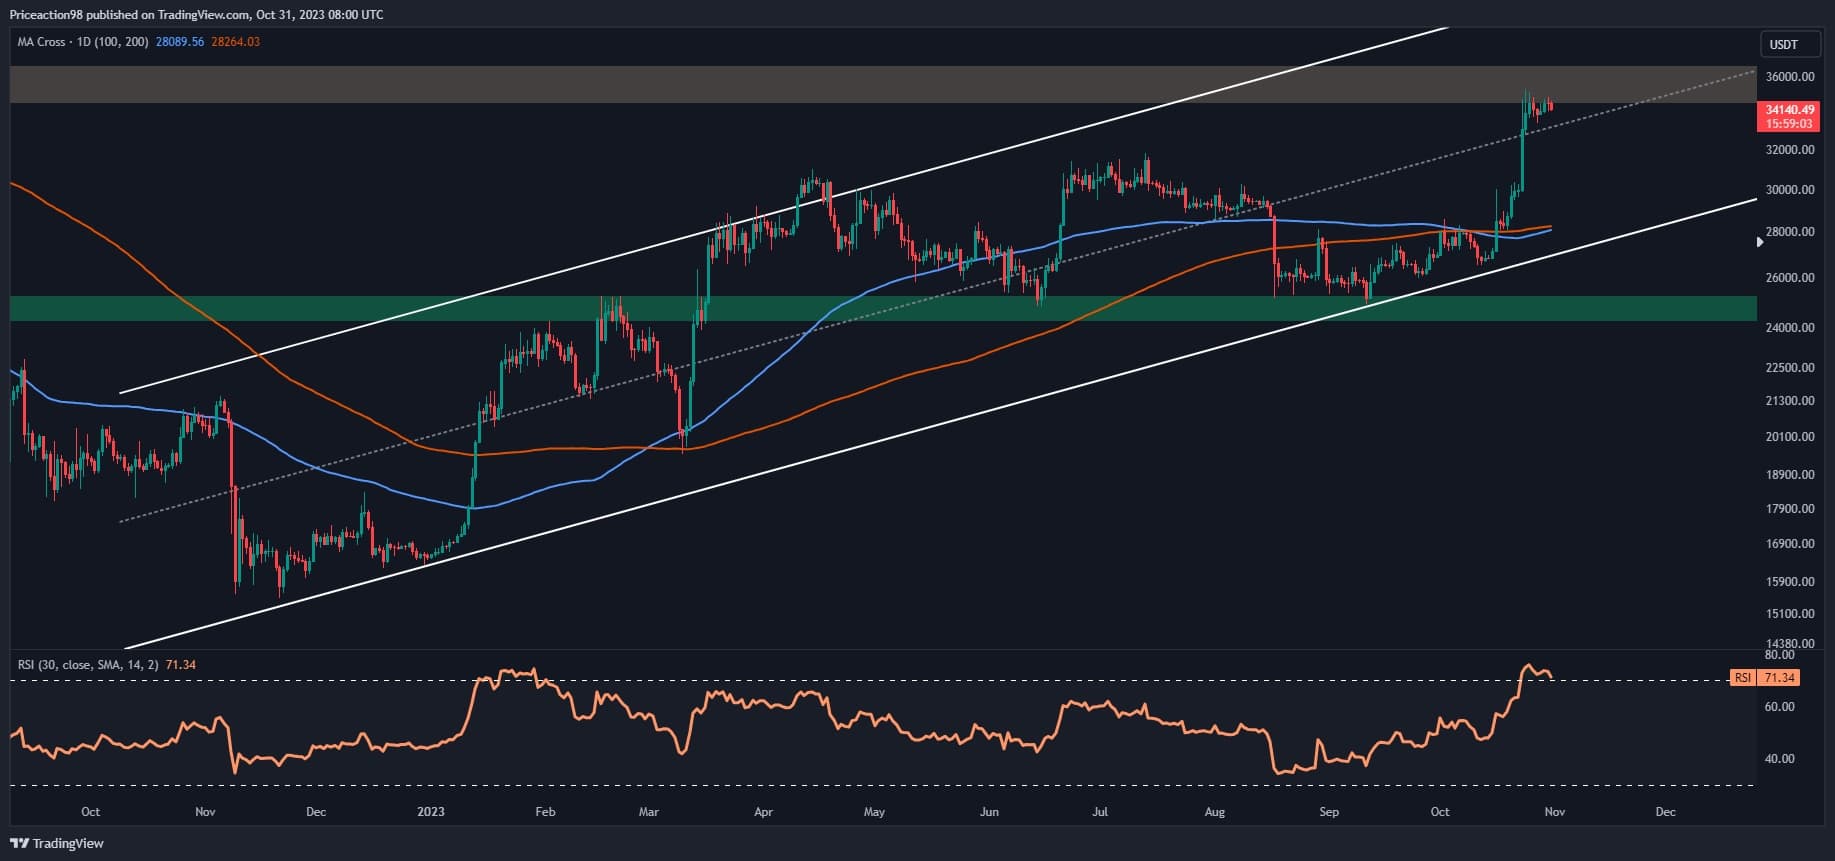
Upon examining the daily chart, Bitcoin has been on a noticeable uptrend since the start of 2023, pushing in an ascending channel pattern with higher highs and lows.
This pattern highlights the prevailing influence of buyers, driving the price close to a crucial resistance level of around $35K. The RSI indicator also corroborates this trend, approaching the overbought territory and indicating heightened buying pressure.
If buyers manage to secure this pivotal level, it could open the door for a positive mid-term trend, potentially targeting higher resistance zones. However, given the rapid price spike, a consolidation correction phase with minor retracements remains highly probable.
The 4-Hour Chart
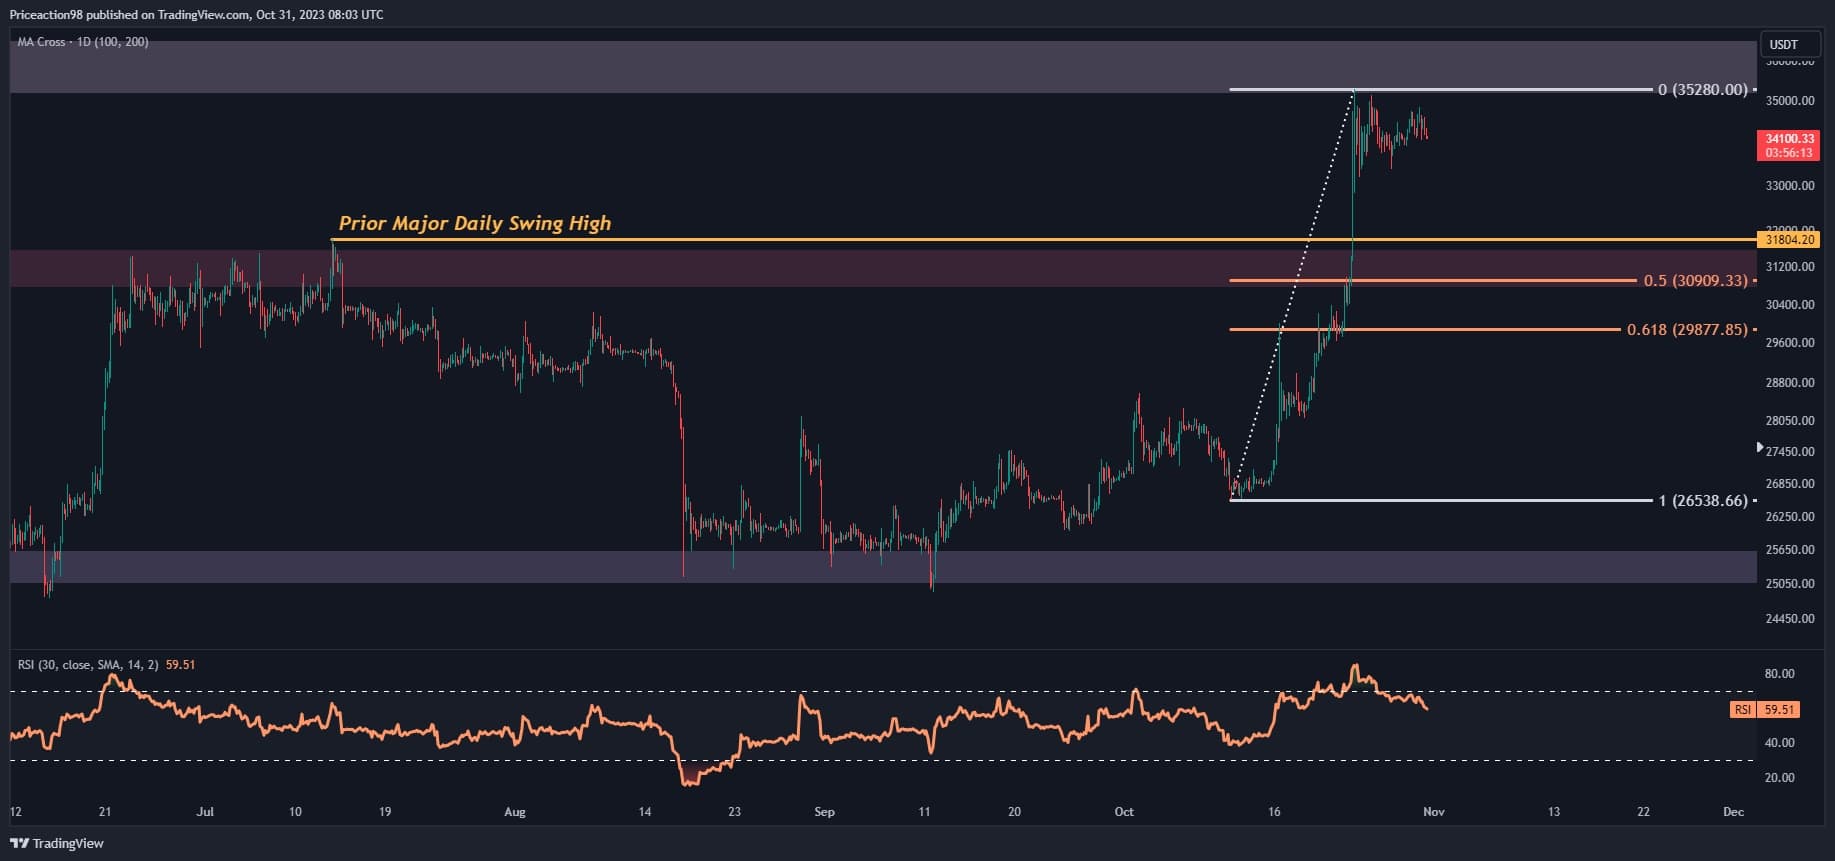
On the 4-hour chart, Bitcoin has surpassed its previous significant daily swing high at approximately $31.8K, sustaining a strong upward momentum. This increase resulted in a new daily high of around $35K, underscoring the prevailing demand in the market.
Nevertheless, the price currently faces substantial resistance at $35K, marked by abundant supply. This resistance has momentarily slowed down the upward movement, triggering a corrective phase. In this scenario, key support levels for Bitcoin include the 0.5 Fibonacci retracement level at $30.9K and the previous swing high at $31.8K.
However, if demand surpasses the available supply, an imminent breakout leading to a robust price surge becomes likely. Regardless of the outcome, close monitoring of price movements in the coming days is essential due to the potential for increased market volatility.
On-chain Analysis
By Shayan
Bitcoin’s recent movements suggest a bullish market trend backed by reliable indicators. However, it is essential to approach the situation cautiously, considering the potential for a correction due to Bitcoin’s rapid value escalation over a short period.
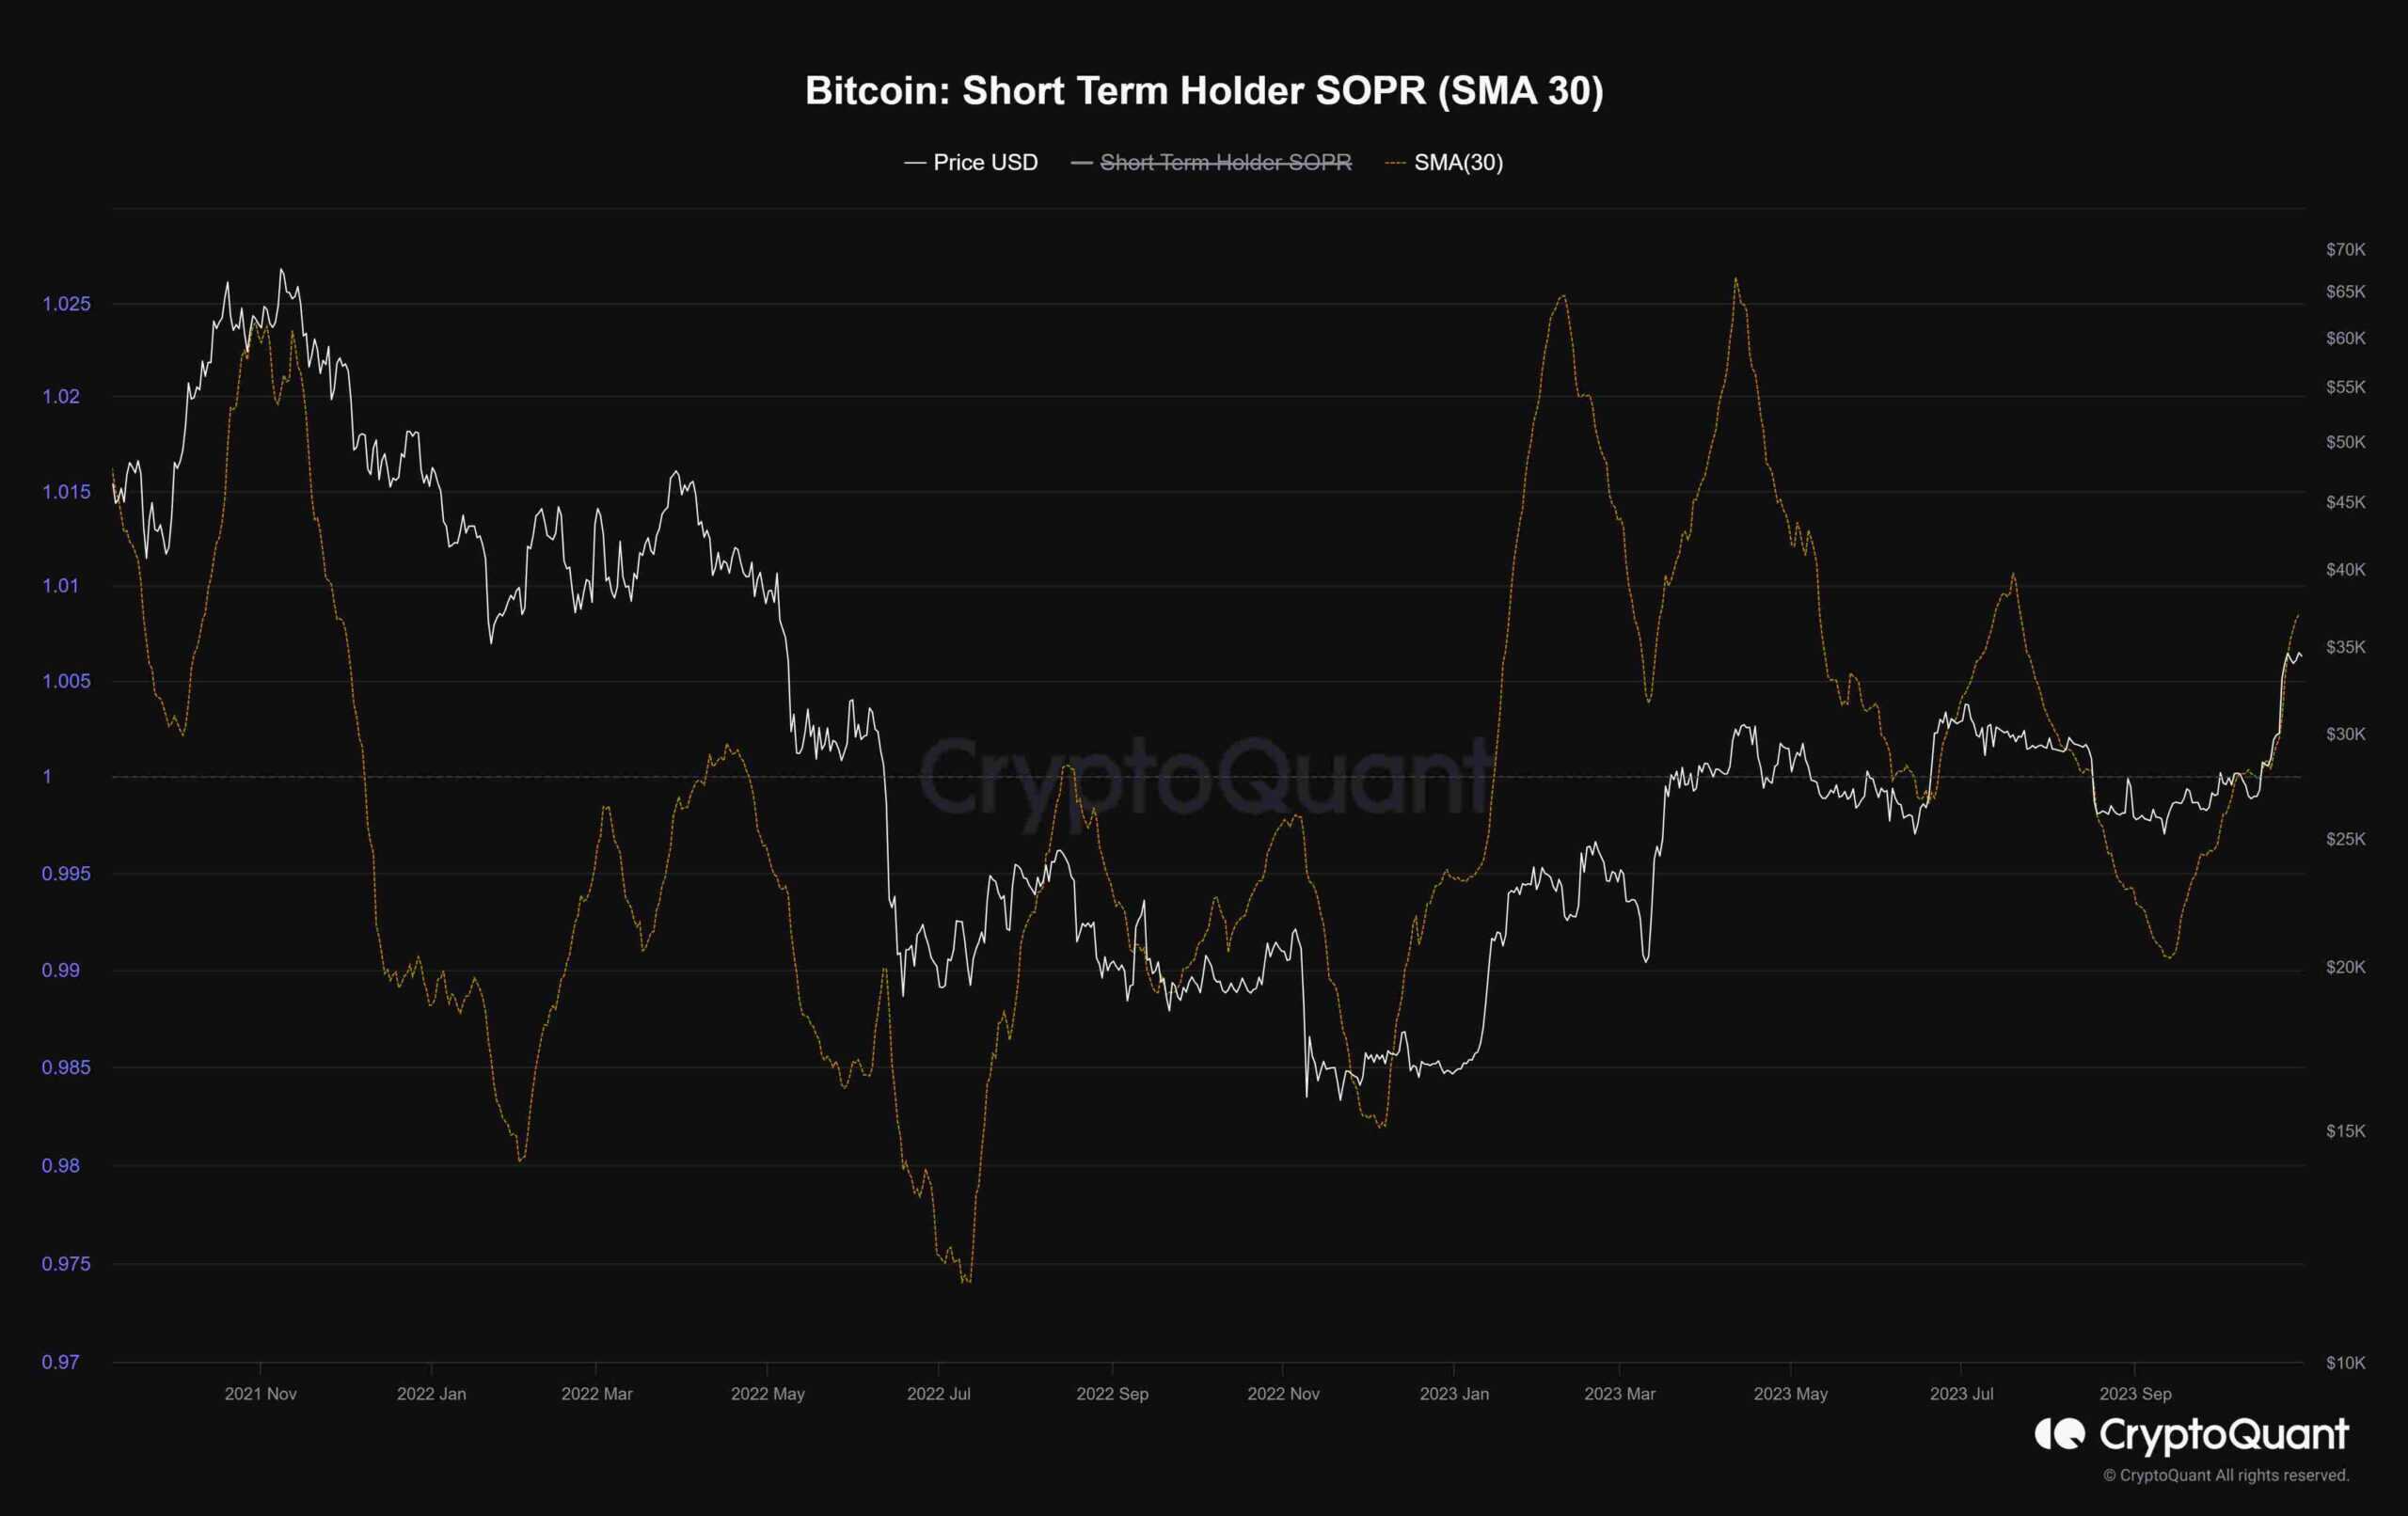
The chart below illustrates the Short-Term Holder Spent Output Profit Ratio (SOPR) metric, incorporating a 30-day moving average. This metric gauges the profitability ratio of short-term spent outputs, referring to coins active for less than 155 days.
The abrupt surge in the Short-Term Holder SOPR metric coincides with Bitcoin’s approach to the critical resistance zone at $35K. This spike implies selling pressure from short-term investors, capitalizing on the price surge to unload their assets and realize profits or cut losses. The $35K level serves as a substantial barrier to Bitcoin’s upward momentum. A breakout above this threshold could potentially eliminate uncertainty and stimulate considerable market demand.
The post BTC Price Rally to $40K or Correction to $31K Next? (Bitcoin Price Analysis) appeared first on CryptoPotato.