ETH Price Analysis: As Bitcoin Parties, Ethereum Sheds 25% BTC-Wise Since September
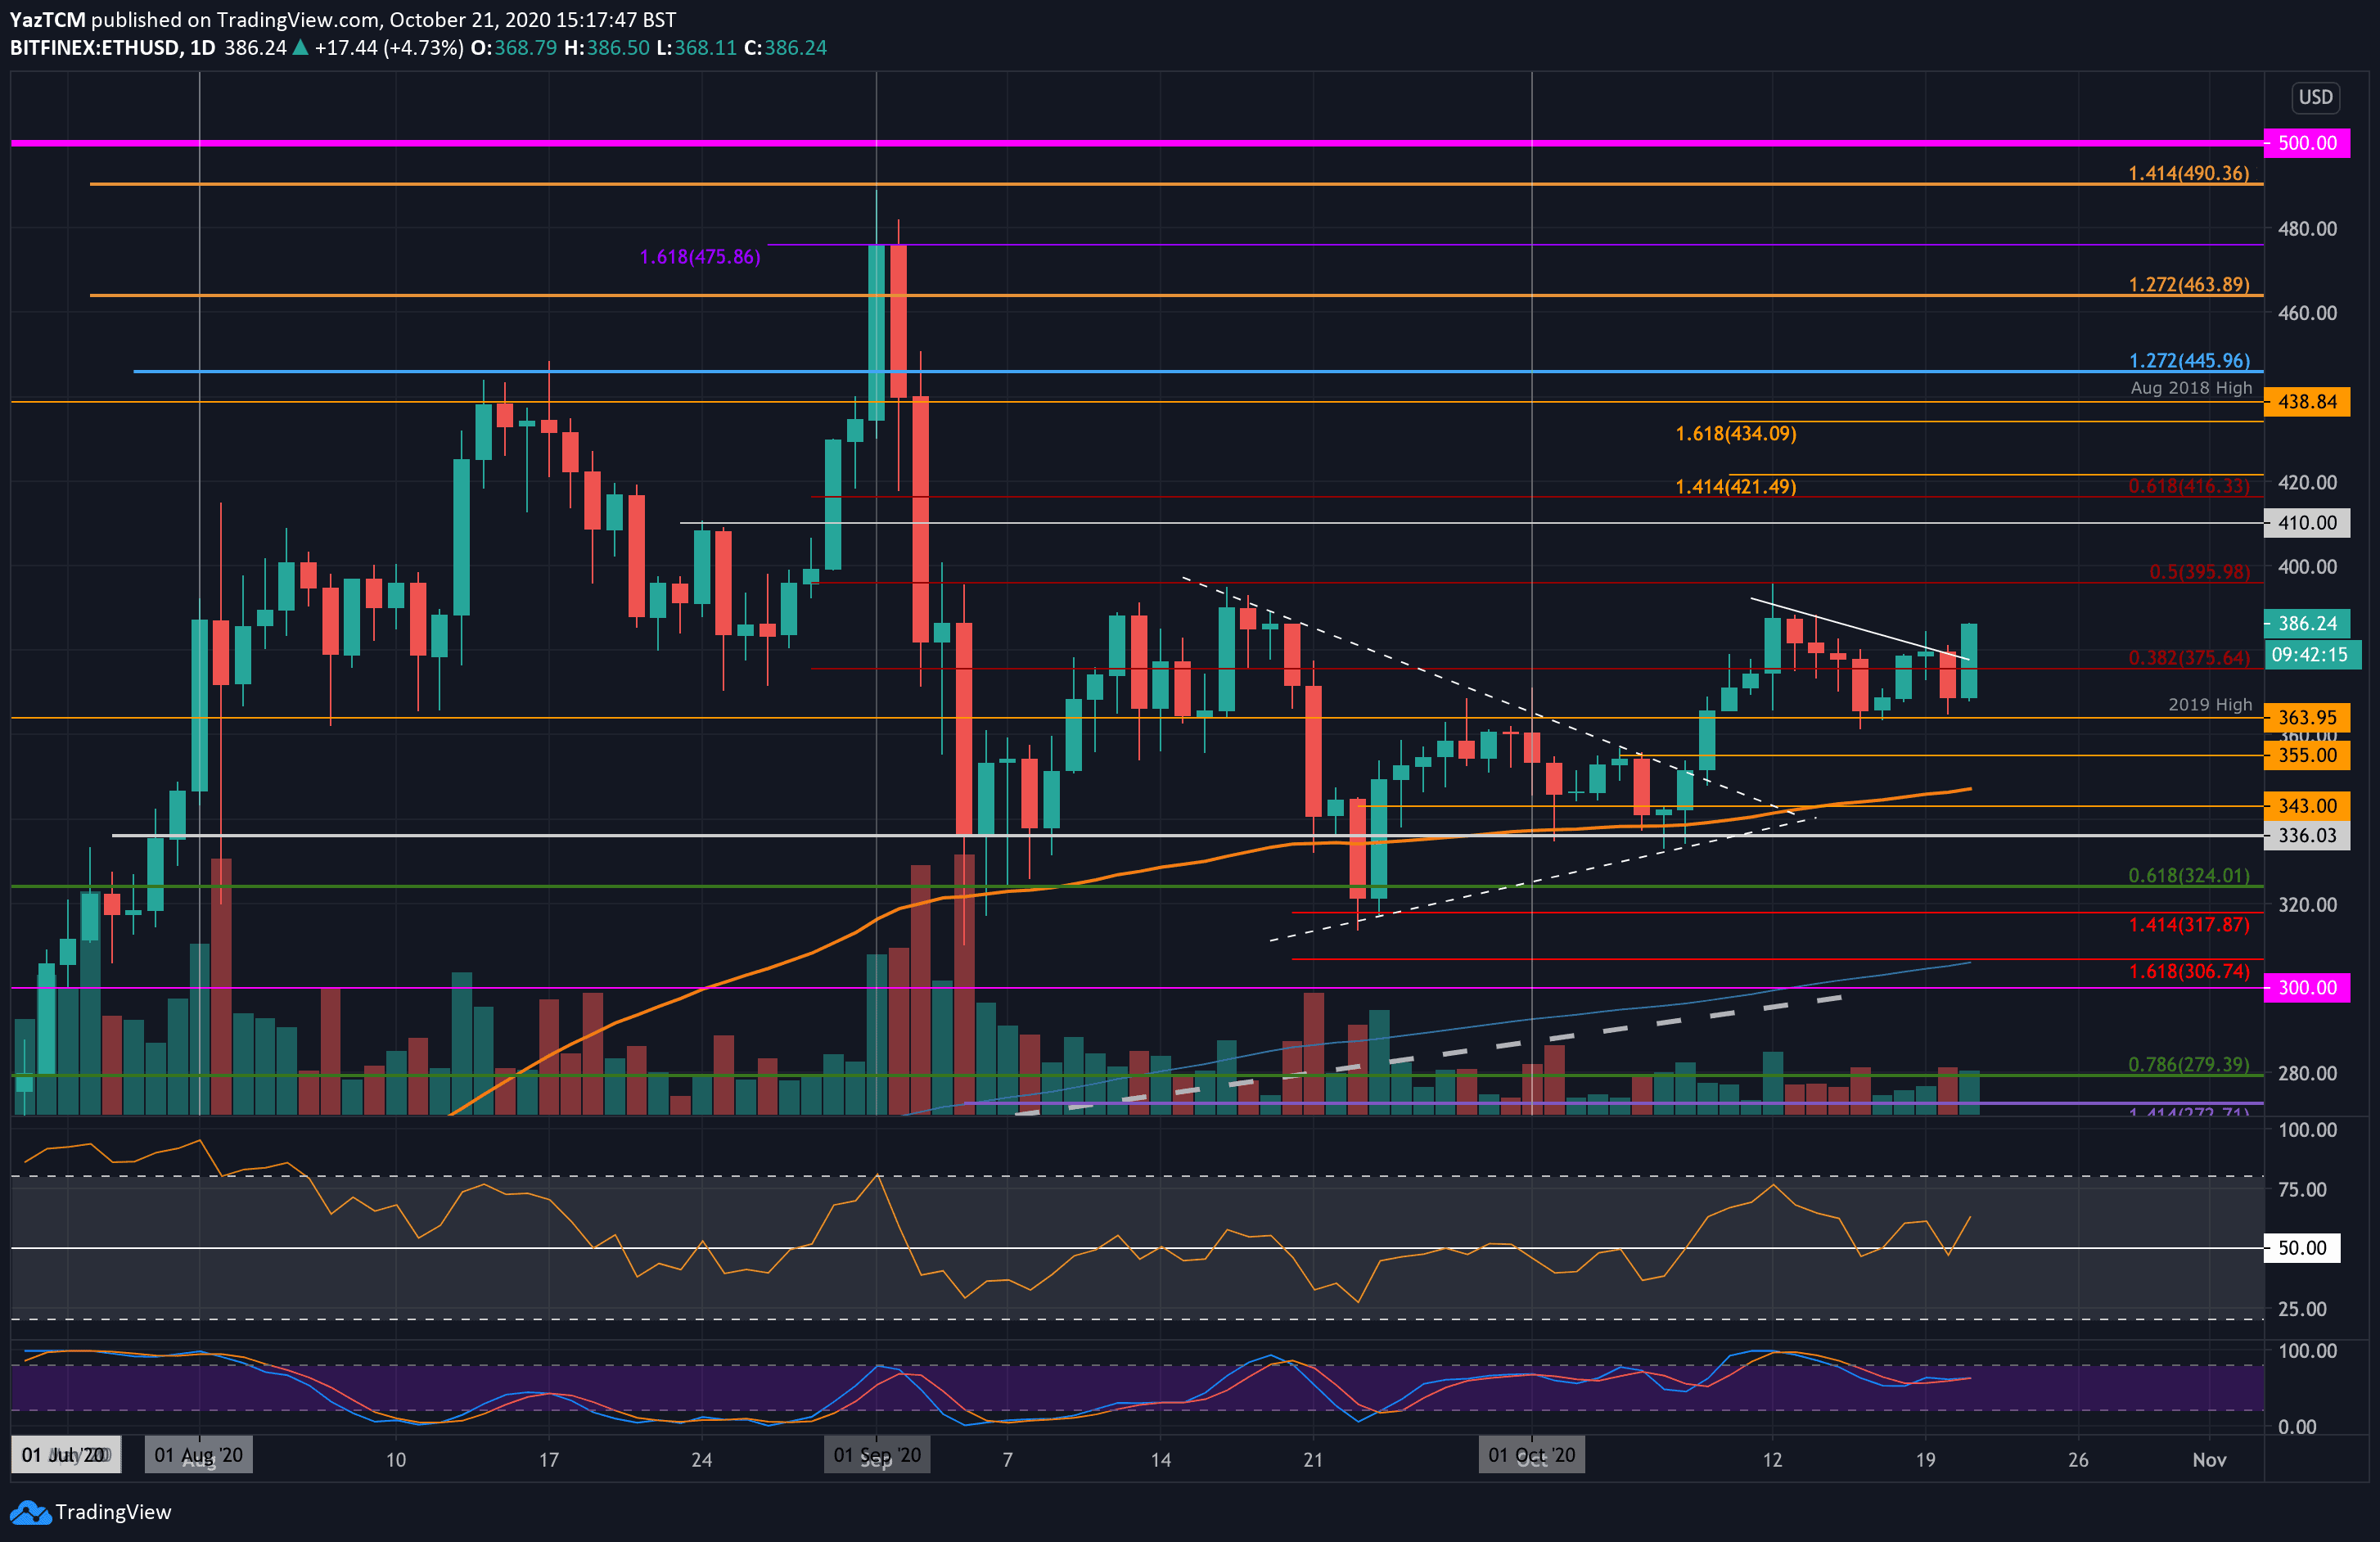
ETH/USD – Bulls Rebound From 2019 Highs.
Key Support Levels: $364, $355, $345.
Key Resistance Levels: $396, $400, $410.
Over the past week, Ethereum was struggling to break above a very short-term falling trend line. The coin dropped into the support at the 2019 Highs around $364 yesterday which allowed it to rebound higher today.
After rebounding, ETH went on to break above resistance at $375.
ETH-USD Short Term Price Prediction
Looking ahead, if the buyers continue to push above $390, the first level of resistance lies at $396 (bearish .5 Fib Retracement & October highs). Following this, resistance lies at $400, $410, and $416 (bearish .618 Fib Retracement).
On the other side, if the sellers push lower, the first level of support is expected at the $364 level (2019 highs). Beneath this, additional support is found at $355, $345 (100-days EMA), and $336.
The RSI rebounded from the mid-line to show the buyers are refusing to give up their control of the market momentum.
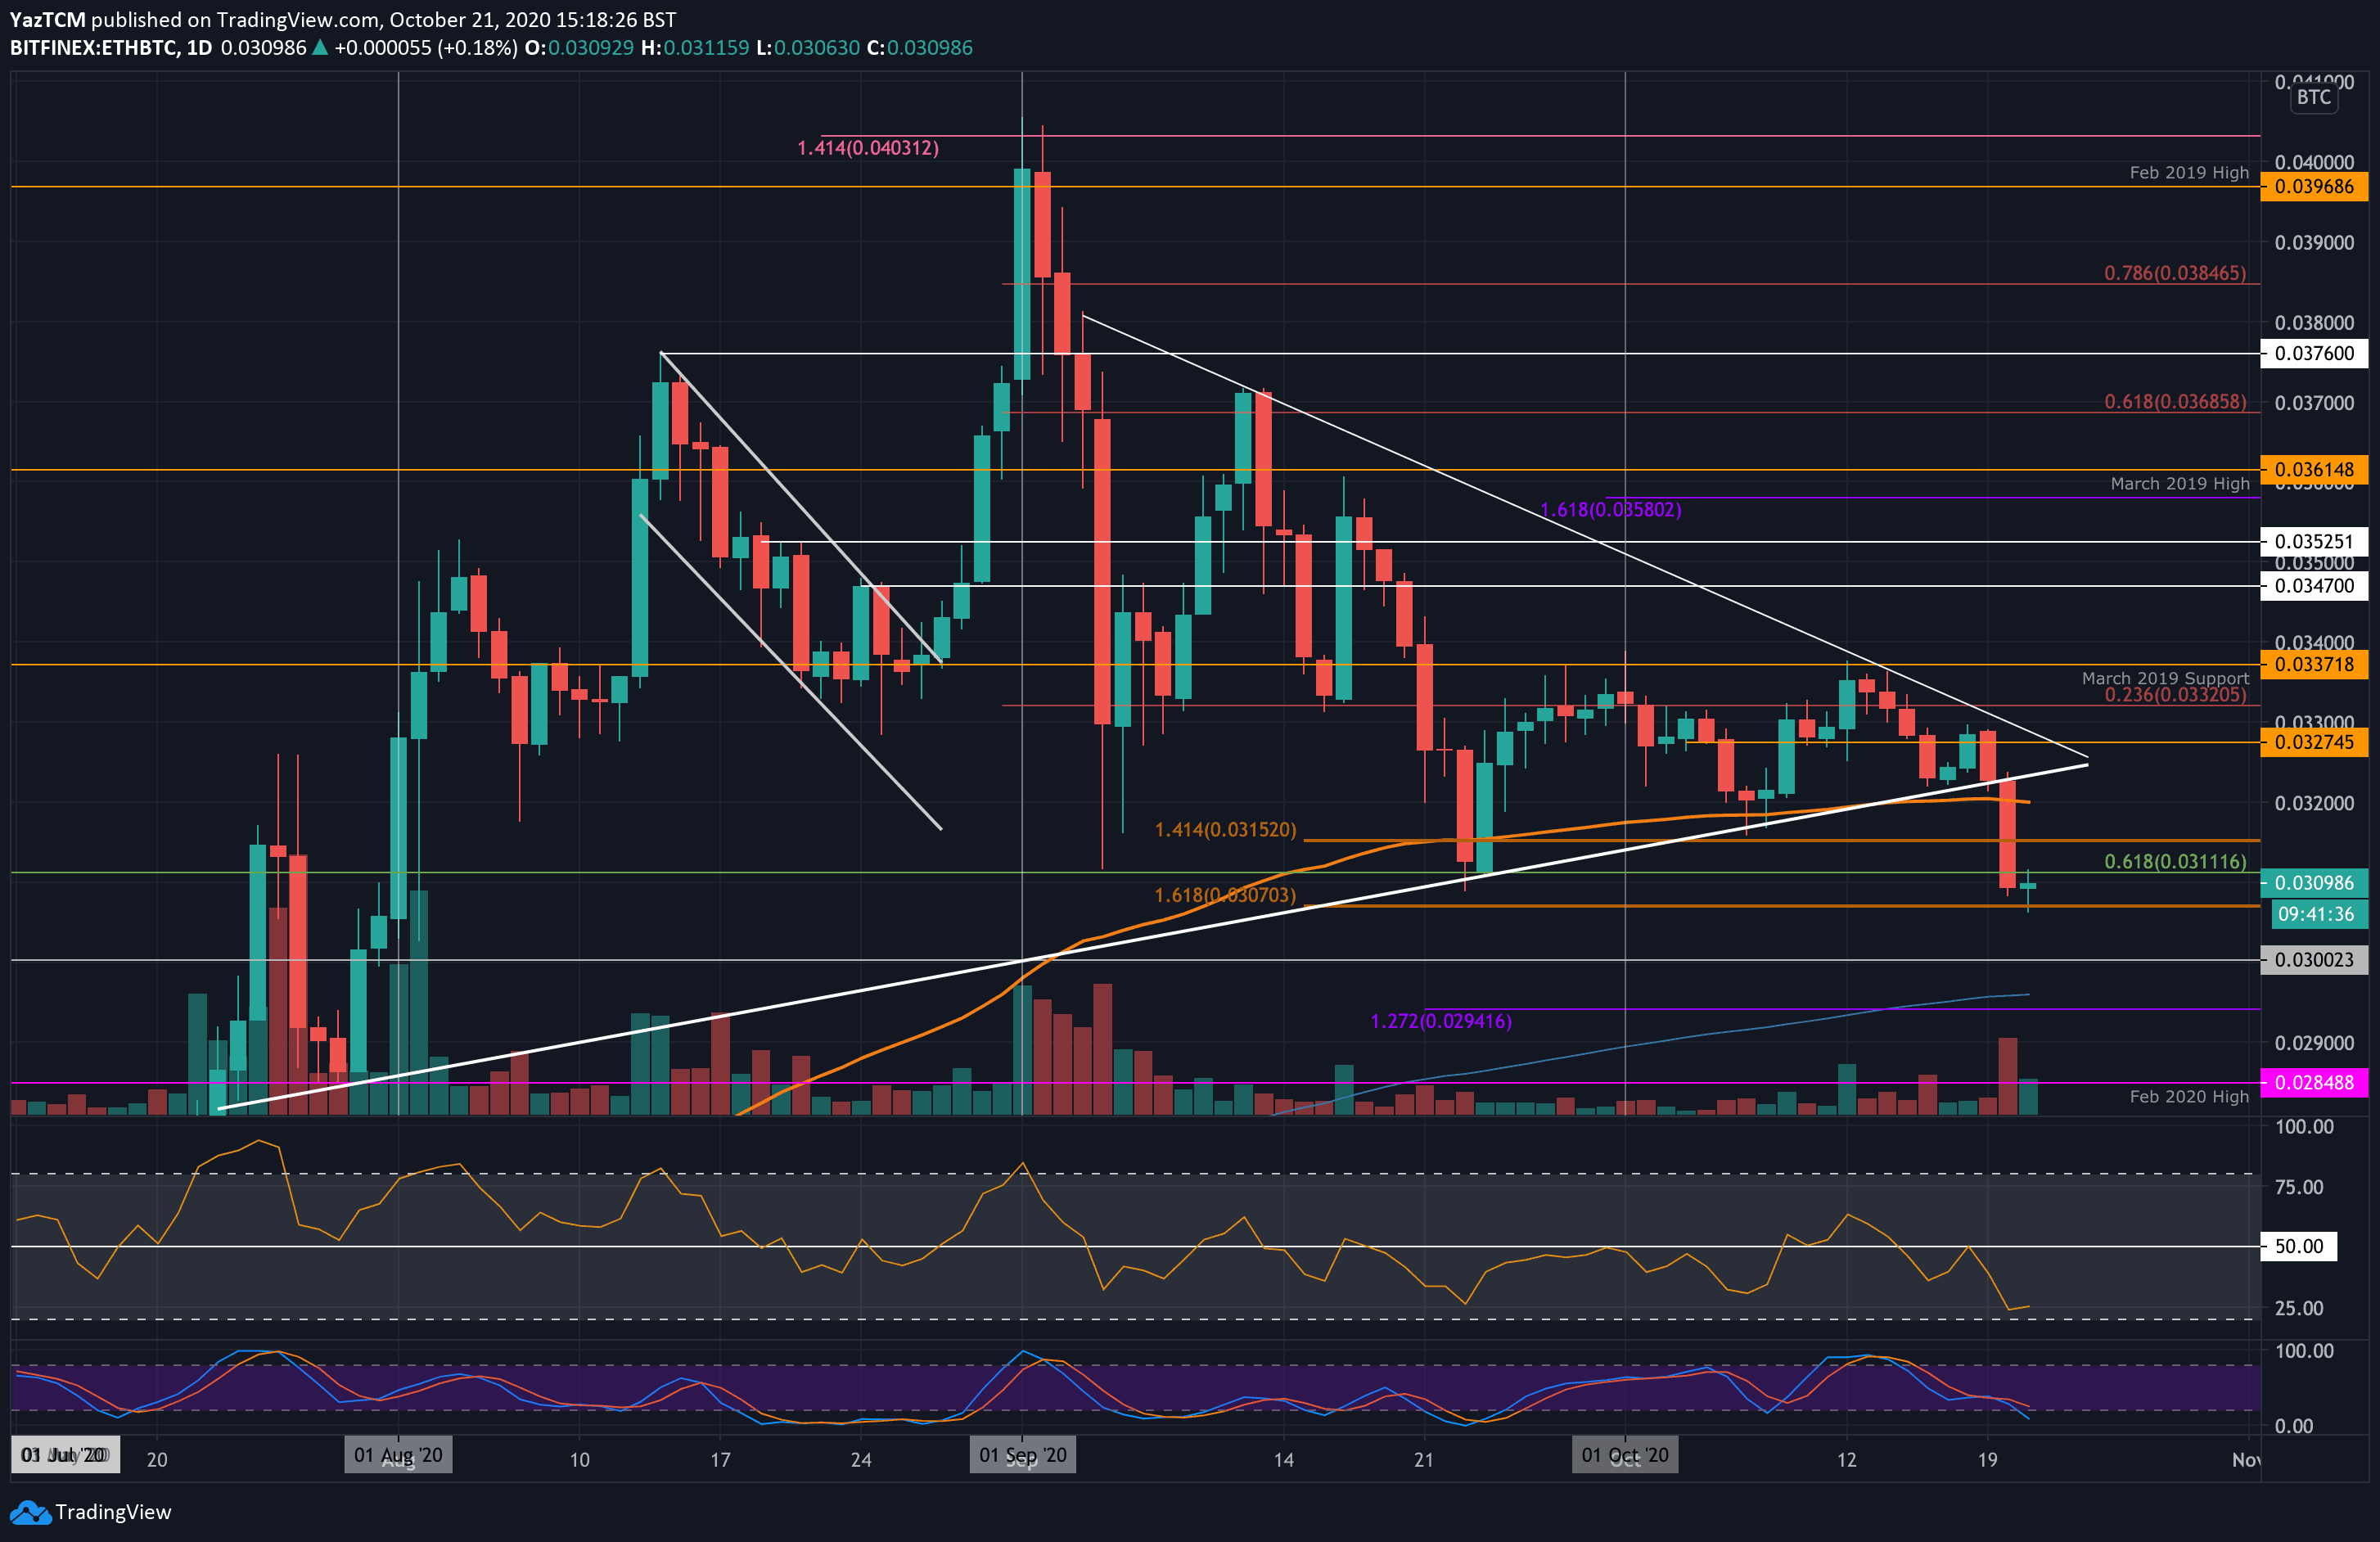
ETH/BTC – ETH Penetrates Beneath Consolidation Pattern.
Key Support Levels: 0.03 BTC, 0.0295 BTC, 0.029 BTC.
Key Resistance Levels: 0.0311 BTC, 0.0315 BTC, 0.032 BTC.
Against Bitcoin, Ethereum was trading within a 1.5-month-old consolidation pattern as it ranged between the two boundaries of a symmetrical triangle. Throughout the week, the buyers defended the lower boundary of this triangle, however, with the recent push of Bitcoin above $12,000 the sellers managed to take over and caused to drop beneath the pattern.
After falling beneath ETH continued to plummet until support was found around 0.0307 BTC – provided by a downside 1.618 Fib Extension level.
It’s worth noting that since September 2nd, ETH has lost just shy of 25% against Bitcoin and the last time its value was as low was on August 2nd.
ETH-BTC Short Term Price Prediction
Looking ahead, if the sellers continue lower, the first level of support lies at 0.03 BTC. Beneath this, support lies at 0.0295 BTC (200-days EMA), 0.029 BTC, and 0.0284 BTC (Feb 2020 Highs).
On the other side, resistance first lies at 0.0311 BTC. Above this, additional resistance is expected at 0.0315 BTC, 0.032 BTC (100-days EMA), and 0.0327 BTC.
The RSI has plummeted to oversold conditions which could suggest that the market is slightly overextended and should reverse pretty soon.
The post ETH Price Analysis: As Bitcoin Parties, Ethereum Sheds 25% BTC-Wise Since September appeared first on CryptoPotato.