Breaking: Bitcoin Price Records a New 2019 ATH and Tops $100 B Market Cap: Analysis & Overview
Yesterday we mentioned Bitcoin reaching to a decision point testing resistance range between $5300 and $5350.
As far as seen now, BTC had broken up to record a new 2019 high over $5700, and also did what the bulls wanted to see: breaking up of $5350 and testing it as support to confirm.
Another thing to note is that Bitcoin maintained to reach the legendary market cap value of $100 billion, on Coinmarketcap. This happens for the first time during 2019. This is thanks to the BTC price difference on BitFinex.
Total Market Cap: $182 Billion
Bitcoin Market Cap: $101.8 Billion
BTC Dominance: 55.5%
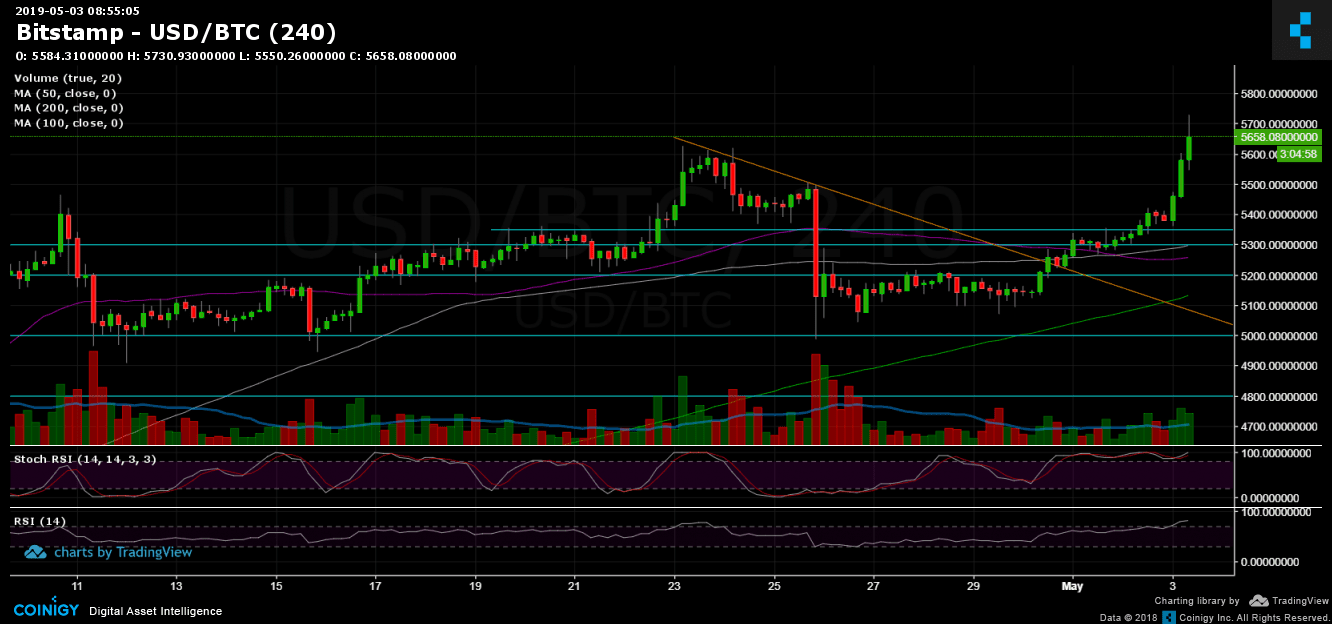
Looking at the 1-day & 4-hour charts
– Support/Resistance:
Following the breakout of the $5350 crucial resistance level, Bitcoin had just reached the 2019 high at $5625, this might turn into resistance (we will see over the next few hours). In case Bitcoin breaks up, the coin will face $5700 – $5800 significant resistance range. The last had held Bitcoin throughout 2018 as support and now turned into strong resistance. Above lies the $6000 level.
From below, the closest level is the resistance turned support $5500, then $5400 and $5300 – $5350 which now turned into support
– Trading Volume: maybe because of the Holidays, the volume is not significant. Let’s wait for the daily candle to close; however, it’s not the volume levels that support a breakout.
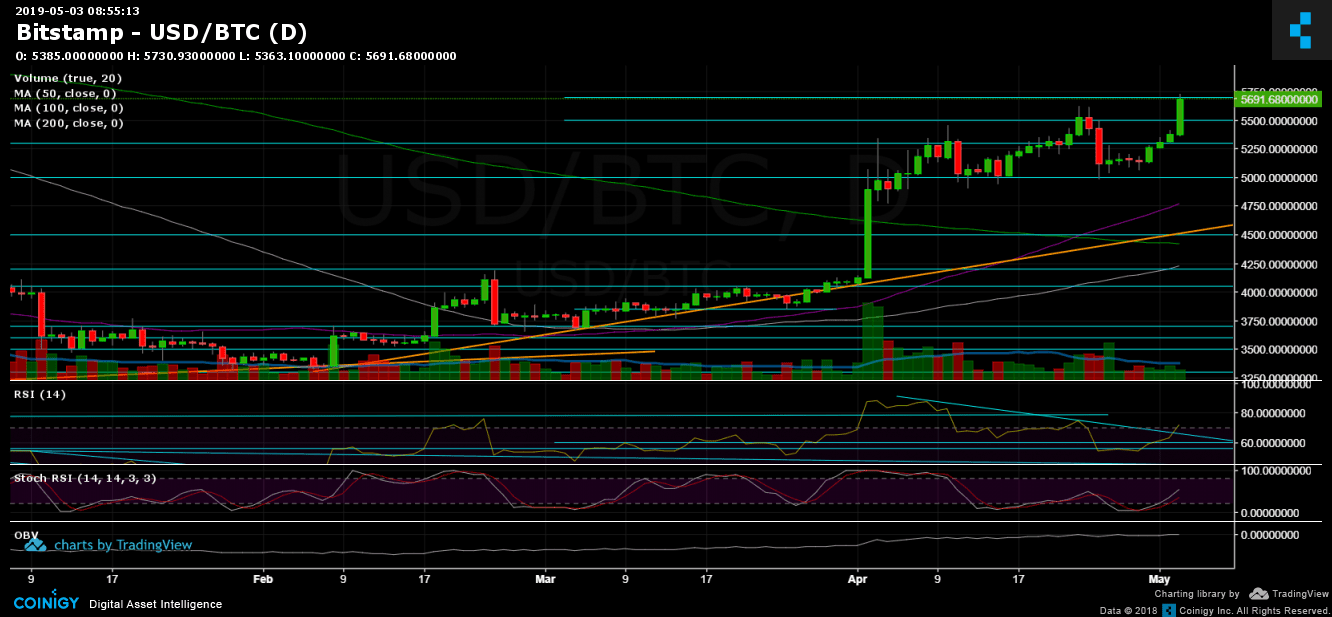
– Daily chart’s RSI: We can see that the daily RSI level is getting close to 70 while encountering a descending trend-line resistance. Yesterday we had mentioned the negative divergence in the daily chart’s RSI, which could turn into a bearish sign.
– BitFinex open short positions: despite the increase in BTC price, we still hadn’t seen a short squeeze. Short positions had declined only 2% since yesterday, to 30.68K BTC open short positions.
BTC/USD BitStamp 4-Hour Chart
BTC/USD BitStamp 1-Day Chart
The post Breaking: Bitcoin Price Records a New 2019 ATH and Tops $100 B Market Cap: Analysis & Overview appeared first on CryptoPotato.