Binance Coin Price Analysis May 3: BNB Drops 7% Against BTC, Struggling To Stay Above 0.004
Binance Coin (BNB) may have seen a steady but stable period over the last week. However, the cryptocurrency is still up by a total of 20% over the past 30 days. Binance Coin is currently trading for a price of $23.37 after seeing an impressive 240% price surge over the past 90 trading days.
Following the surging Bitcoin, the coin had lost 7% from its BTC value, while against the USD the price hadn’t moved over the past 24 hours.
The coin is still the 7th largest by market cap as it presently holds a $3.31 billion market cap value.
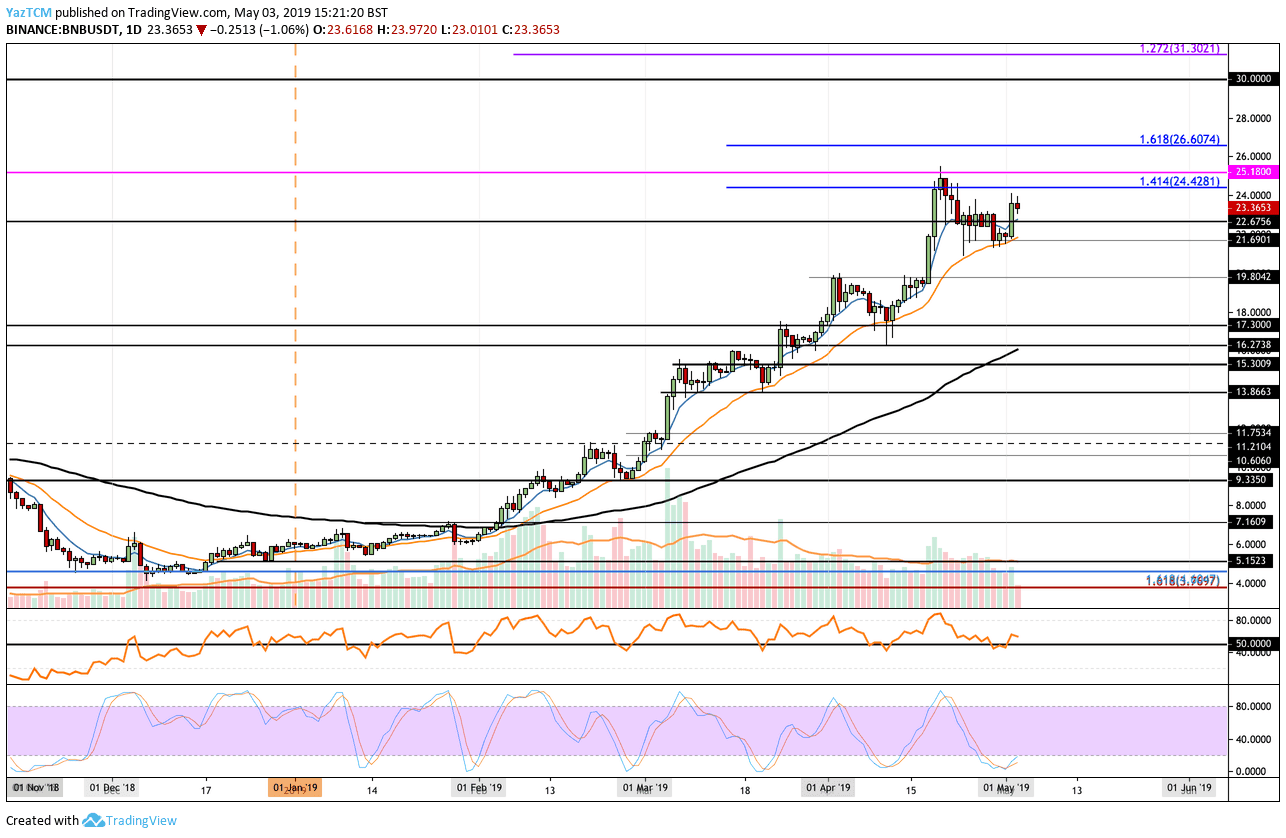
Looking at the BNB/USD 1-Day Chart:
- Since our last BNB/USD price analysis, we can see that the market had continued to fall lower into support at $21.70. BNB had managed to find support at that price level, and since then, the price has slightly rebounded.
- From above: The nearest levels of resistance now lie at $24 and $25.18 (the previous ATH). Further resistance lies at $26.60, $28, and $30.
- From below: The nearest levels of support lies at $22.67, followed by the $21.70 level. Further beneath is $21.70, before reaching the significant $20 level.
- The trading volume remains below average but has started to show some signs of recovering over the past couple of days.
- The Stochastic RSI oscillator has recently gone through a crossover signal in oversold territory, which may lead to a positive correction move. Furthermore, the RSI itself has managed to rebound at the 50 level as the bulls maintain possession of the market momentum.
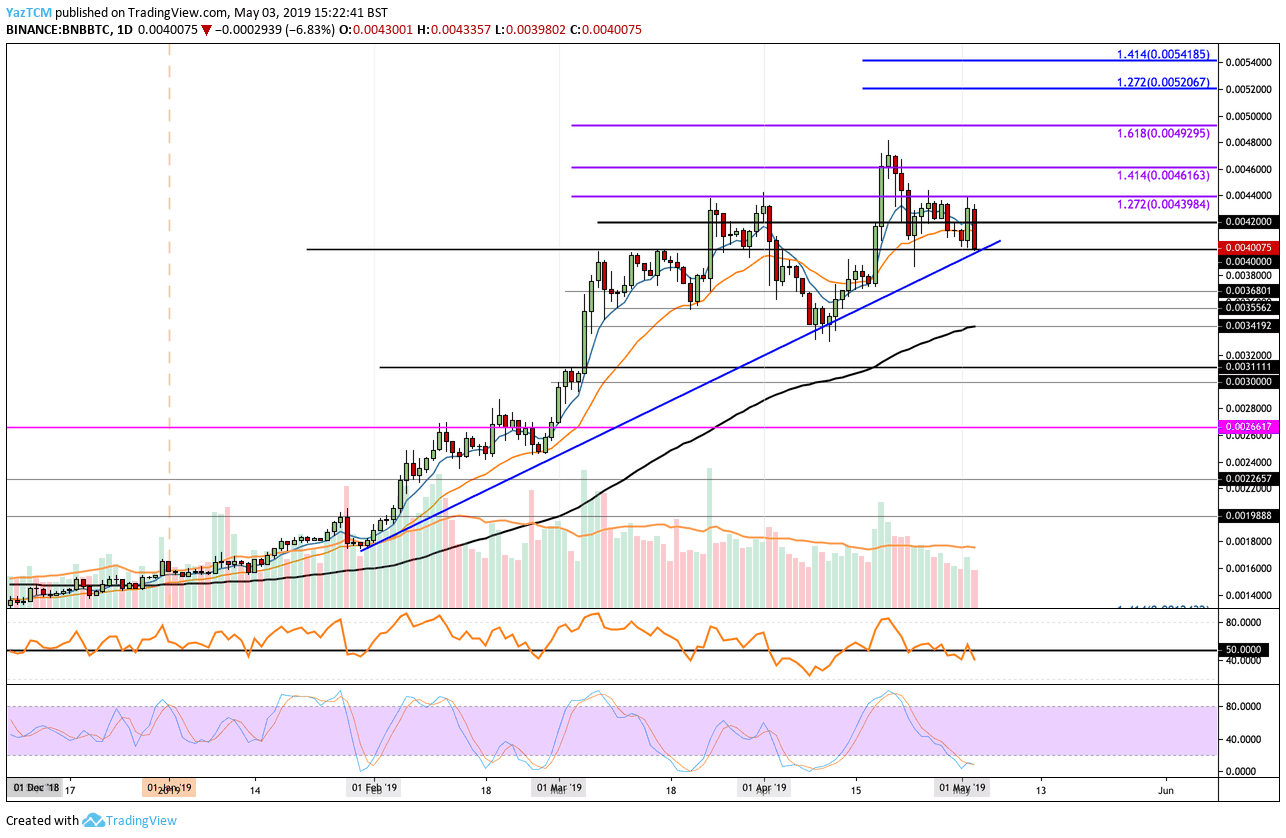
Looking at the BNB/BTC 1-Day Chart:
- Following our previous BNB/BTC analysis, we can see that BNB has fallen further down against Bitcoin. The market has now found support around 0.0040 BTC where lies a long term ascending trend line.
- From above: The nearest levels of resistance lie at 0.0042 BTC and 0.0044 BTC. Further resistance then lies at 0.004615 BTC and 0.0048 BTC, which is the BNB’s all-time high against Bitcoin.
- From below: The nearest level of support beneath the descending trend line lies at 0.0038 BTC. Further support lies at 0.003680 BTC and 0.00355 BTC.
The post Binance Coin Price Analysis May 3: BNB Drops 7% Against BTC, Struggling To Stay Above 0.004 appeared first on CryptoPotato.