Bitcoin Surges $700 in 24 Hours – Is $11K Around the Corner? BTC Price Analysis
In our recent Bitcoin price analysis two days ago, we identified bullish signs for Bitcoin, still under $10,000 at the time.
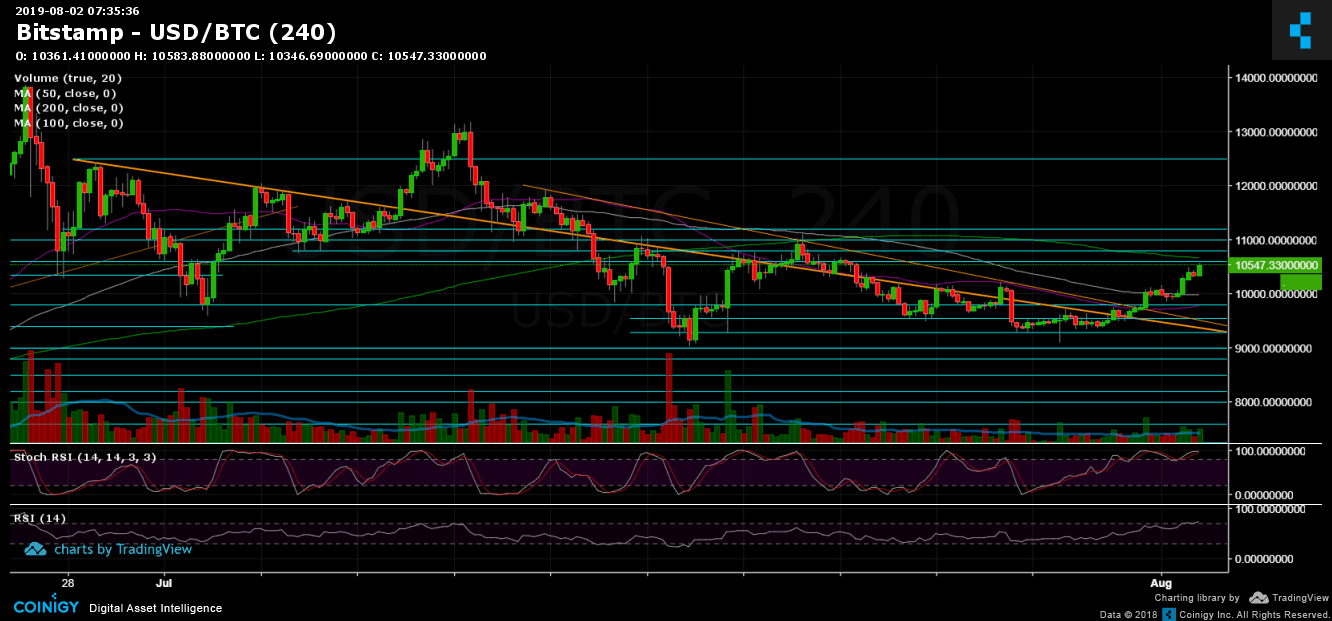
Since our analysis, and over the past two days, Bitcoin gained momentum, breaking above the mentioned resistance level provided by the 4-hour MA-50 (~$9,700), along with the descending trend line. Since then, we saw consolidation at the $10K level (along with the MA-100, marked by a white line on the 4-hour chart) and a surge following the break above $10K.
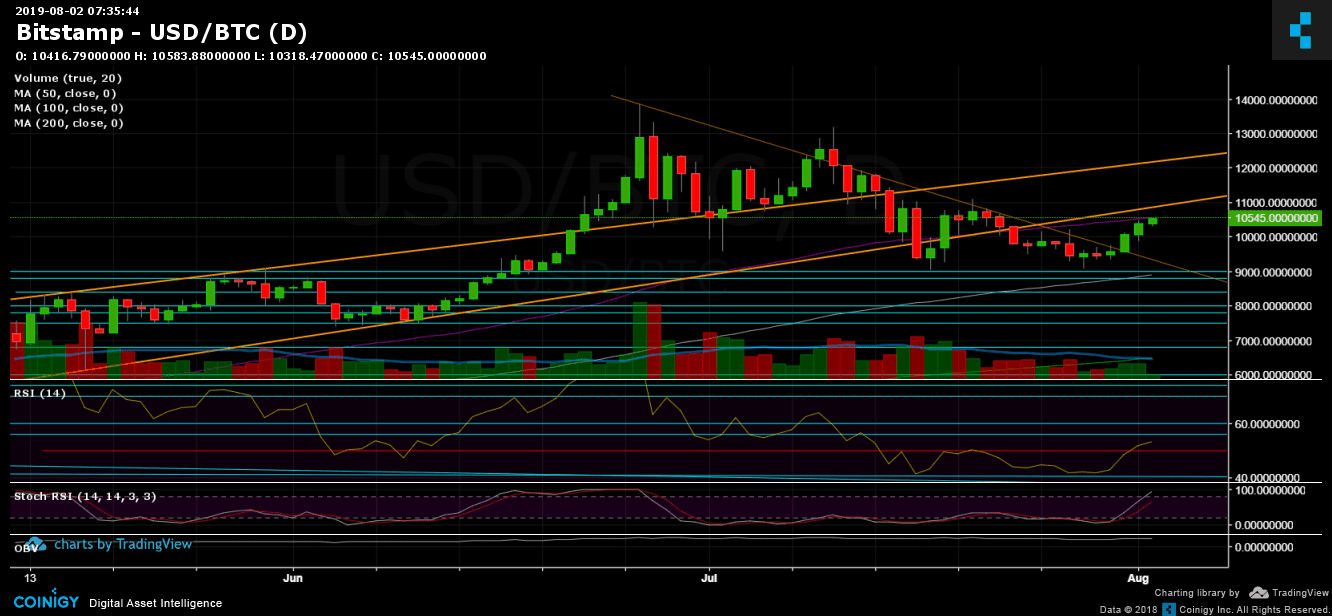
As of now, the coin is encountering its first major obstacle – the support-turned-resistance area of $10,500-$10,600 along with the 50-day moving average line (marked in purple on the 1-day chart below).
Was that the last time we will have seen Bitcoin under $10,000? Only time will tell.
Total Market Cap: $286 billion
Bitcoin Market Cap: $188 billion
BTC Dominance Index: 65.8%
*Data from CoinGecko
Key Levels to Watch
Support/Resistance: As stated above, Bitcoin is now facing the old $10,5000-$10,600 support-turned-resistance area along with the daily MA-50. With a break above these levels, the next resistance would lie at $10,800, which is the long-term ascending trend line (seen below), before another major resistance zone at $11,000-$11,200. Further above are $11,500, $11,800, and $12,000.
From below, resistance-turned-support levels exist at $10,200, $10,000 (4-day MA-100) and $9,800.
Daily chart’s RSI: Following the recent spike, we finally saw the RSI indicator (shown on the daily chart below) gain momentum, surpass 50, re-enter bullish territory, and create a higher low, which is fabulous for Bitcoin bulls.
Trading Volume: Despite the decent gains, the volume is not yet here. The last two days carried higher volume than the rest of the past week. However, it’s still far below volume levels produced over the past two months.
BTC/USD Bitstamp 4-Hour Chart
BTC/USD Bitstamp 1-Day Chart
The post Bitcoin Surges $700 in 24 Hours – Is $11K Around the Corner? BTC Price Analysis appeared first on CryptoPotato.