Bitcoin Price Analysis Sep.4: A stable rise?
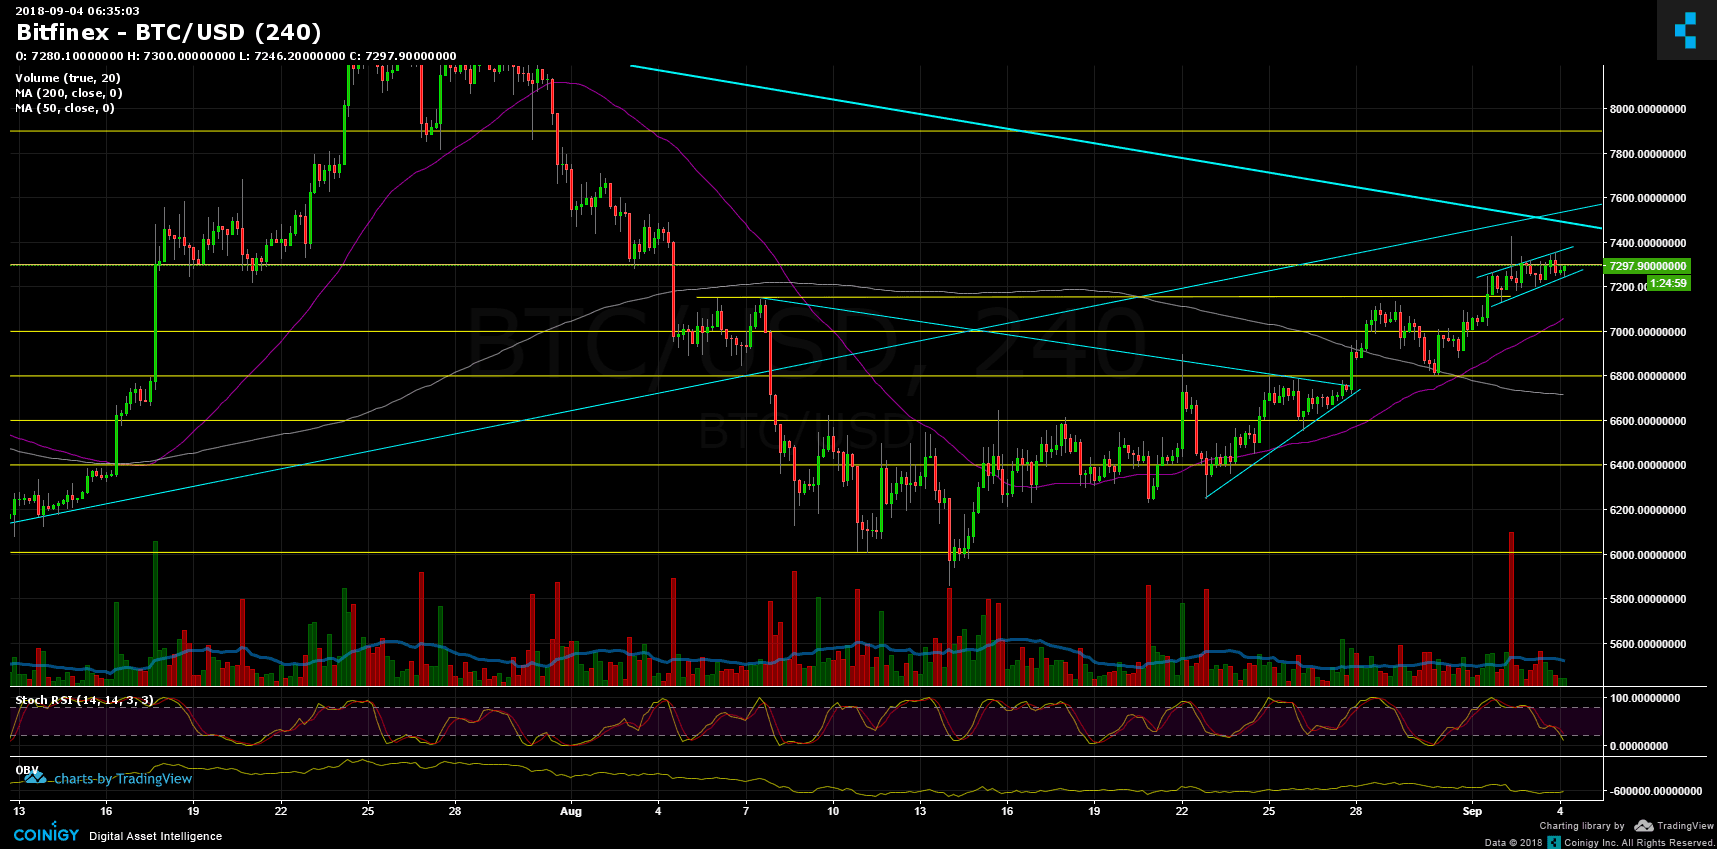
Over the past 48 hours since our last BTC price analysis we saw a stability around the $7200 – $7300 area. As mentioned, the $7300 is a tough resistance level. If and once broken up – we can expect re-test of next target level at $7500 – $7600 zone.
RSI levels are at their low. It might indicate that the market is oversold and ready for another leg up.
From the bear side, Bitcoin is forming a ‘channel’ (marked in light blue on the chart). Breaking it down will likely to send BTC to re-test $7140 and $7000 support levels. The next strong support lies around $6800 – support level along with moving average 200 days (pink line on the chart).
Also, right by the time of the expiration of the CME futures (last Friday at 15:00 UTC), there indeed was a strongn move, but to the positive side: the green candle from $6800 to $7013 (on BitFinex exchange).
To sum up
Support levels lie at $7140, $7000, $6800 (strong support).
Resistance levels lie at $7300, $7500 – $7600 (the long-term descending line), $7900.
Bitcoin Prices: BTC/USD BitFinex 4 Hours chart
Cryptocurrency charts by TradingView.
The post Bitcoin Price Analysis Sep.4: A stable rise? appeared first on CryptoPotato.