Bitcoin Price Analysis March.28: Another Retest of $4K – Can BTC Finally Overcome The $4050 Resistance?
Following our previous price analysis, yesterday we had seen Bitcoin surging almost $100 intra-day in order to retest the daily chart’s mid-term ascending trend-line from below.
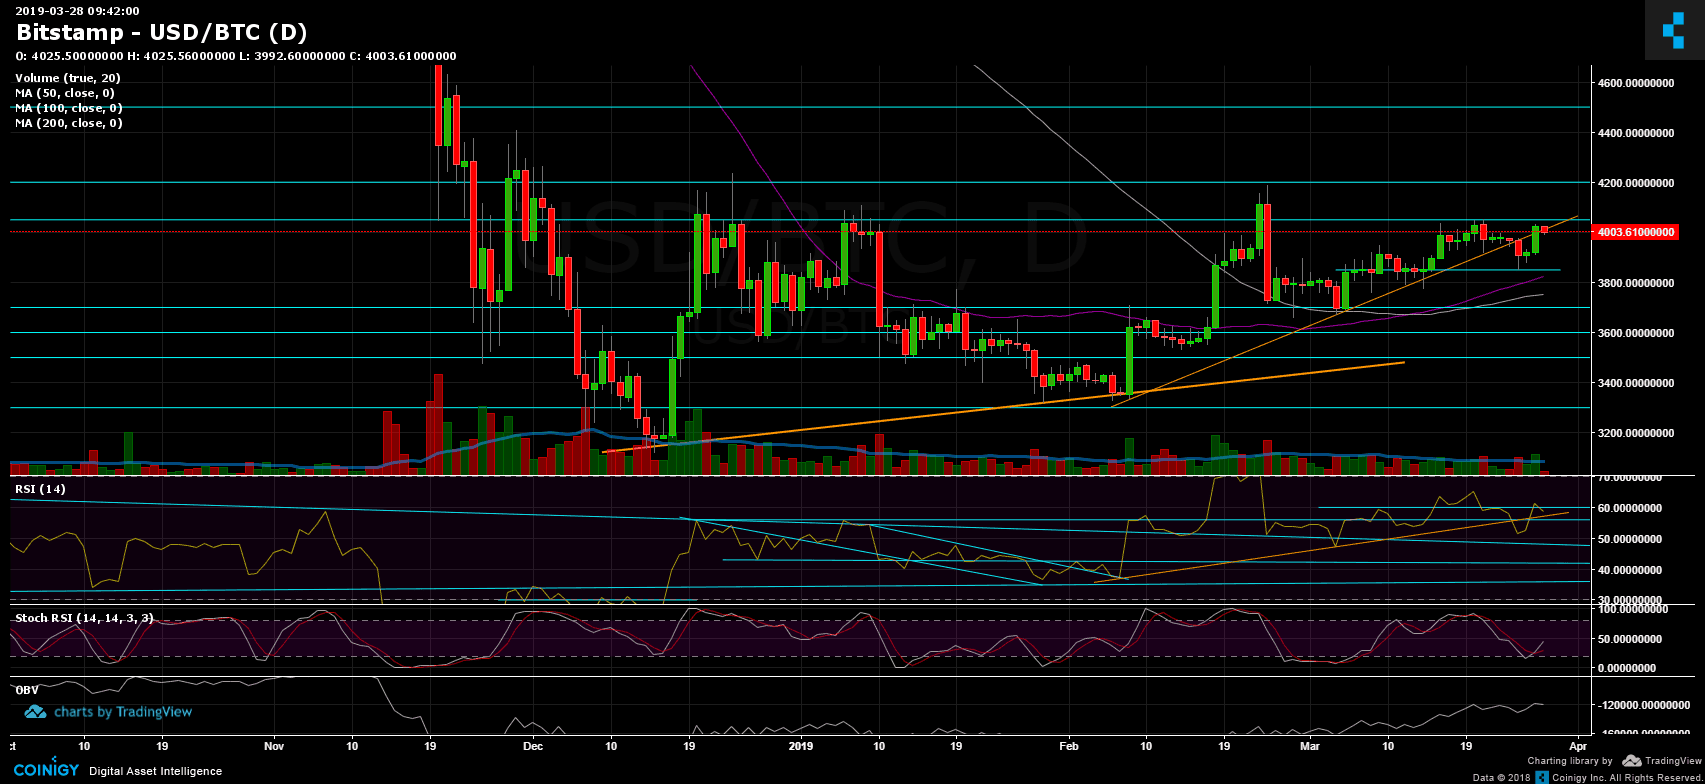
As can be seen on the daily chart, there is not much of a change: From above Bitcoin is struggling with the $4050 boundary, whereas from below is the $3800 area: This is the story of March so far.
Unlike Bitcoin, most of the mid-cap altcoins are spiking, which causes the BTC dominance to record today a new lowest point since August 2018.
Total Market Cap: $142.35 Billion
Bitcoin Market Cap: $71.6 Billion
BTC Dominance: 50.3%
Looking at the 1-day & 4-hour charts
– Support/Resistance:
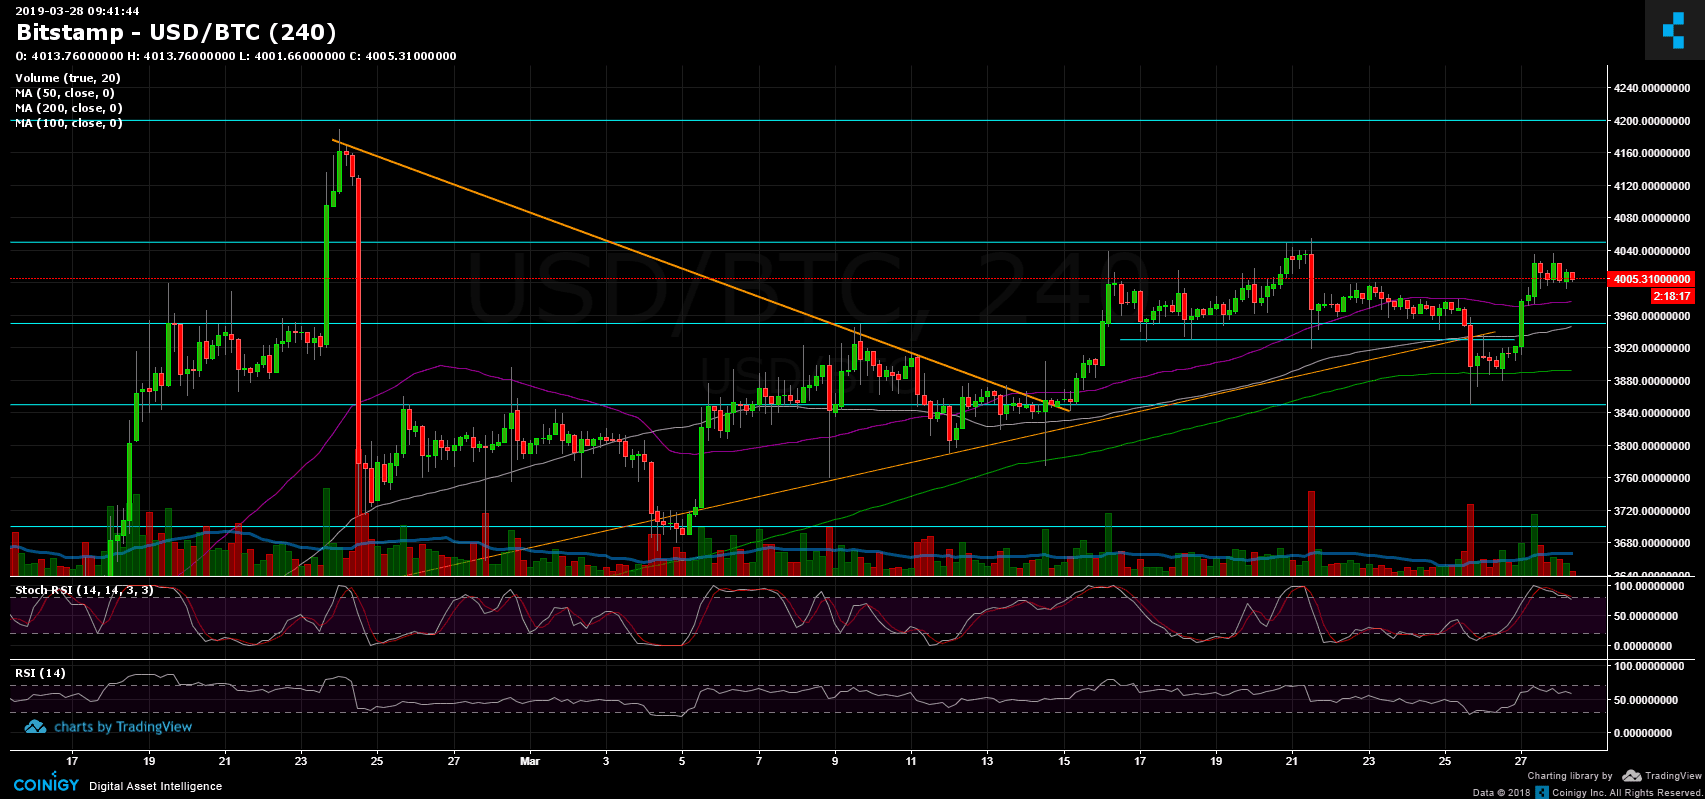
As mentioned above, Bitcoin is now retesting the 1-day ascending trend-line from below (as resistance) and now facing the $4000 – $4050 area. Success in breaking up (finally) the ascending trend-line along with $4050 will likely send Bitcoin to retest the good old $4200 resistance level.
From below, the nearest support lies at the $3930 – $3950 area. Further below is the daily chart’s 50-days moving average line, along with the $3850 strong support. The last support level was retested just three days ago. Below lies the $3750 (MA-100) and the $3700 key support zone.
– The daily chart’s RSI level: Following the recent BTC spike, the RSI got rejected in the 60 level. As of now, the RSI is still in the bullish territory, facing the 56 support zone.
– Stochastic RSI oscillator had recently crossed over in the daily chart’s oversold area. This could be a sign for the buyers to push the price to surpass $4050 finally.
– The daily trading volume: As mentioned before, the amount of volume is not significant in comparison to 2019.
– BitFinex open short positions: There was a substantial drop in the open short positions to 18.6K BTC open positions. However, the longs also had dropped. This reduces the opportunity for price manipulation.
BTC/USD BitStamp 4-Hour Chart
BTC/USD BitStamp 1-Day Chart
The post Bitcoin Price Analysis March.28: Another Retest of $4K – Can BTC Finally Overcome The $4050 Resistance? appeared first on CryptoPotato.