Bitcoin Price Analysis Sep.20: A Very Weird BTC behavior
Heart attack! If you are new to crypto trading, then 12 hours ago you received a warm welcome. In less than 90 minutes Bitcoin went from $6330 to a low of $6100 (Bitfinex) and then climbed quickly to a high of $6550 before settling back in the good old range of $6300 – $6400.
What happened and what can be learned?
When looking for reasons, in my opinion it can be related to but not limited to one or more of the following:
- CBOE Bitcoin futures expirations exactly around that time (20:00 PM UTC). CBOE is the smaller futures exchange out of the two, including CME. Hard to believe this caused such significant disruptions but maybe a whale took a large position before.
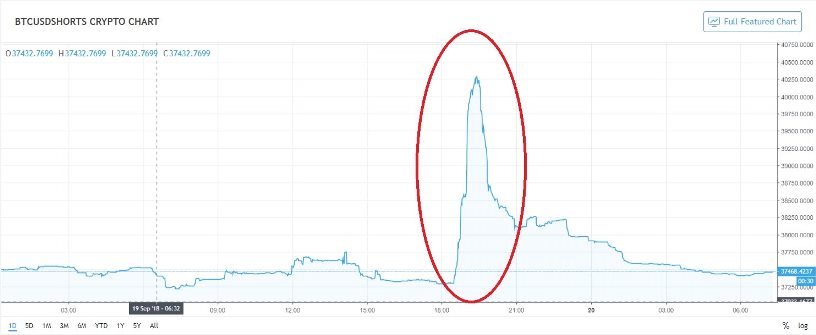
- Strange planned behavior of long squeeze and then a short squeeze by a whale on Bitfinex. The following is the Bitcoin shorts positions marked is the specific time period of action.
- Relation between the conservative exchange trade (TLRY in particular). When analyzing what was going on during yesterday’s trading, it looks like there is a mysterious inverse correlation between TLRY and Bitcoin. In recent weeks people have compared these two a great deal and we noticed headlines of the “Nasdaq became crypto” style.
And above all, the best explanation is that “this is crypto”. We’ve seen even more strange behavior over the past years of trading crypto. Let’s sum up and analyze the current chart:
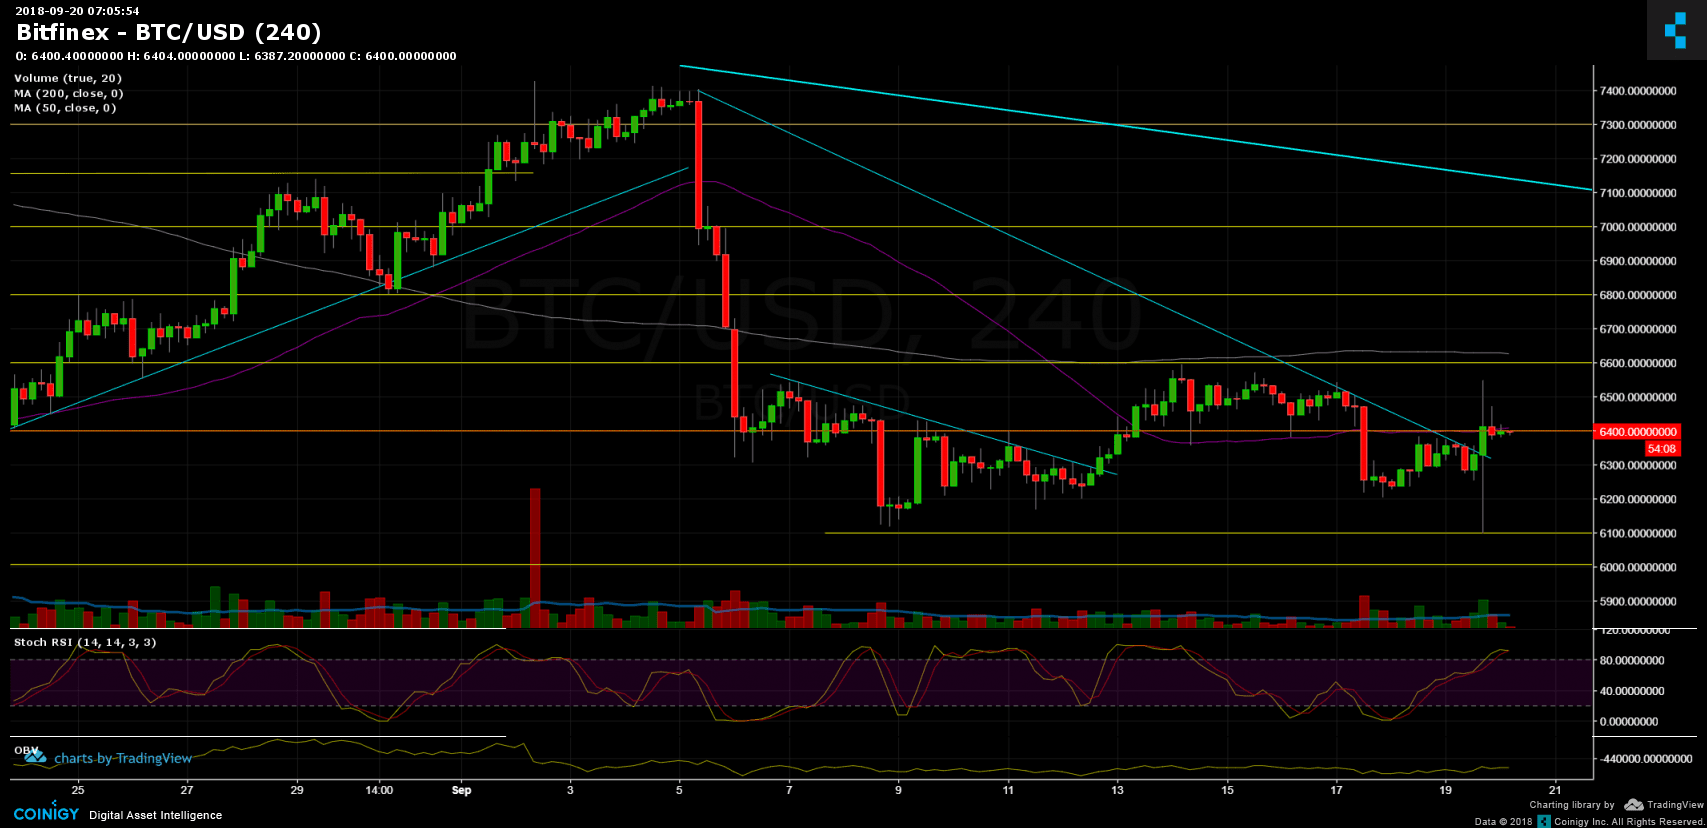
- We can’t really take in account the strange candle, expect for the fact that we will likely see more of those as we are getting closer to the SEC’s September 30th ETF decision, but what is interesting is the low of the candle, $6100, this level was mentioned as the support to watch out for in our recent weekly crypto market update.
- Bitcoin breached the descending trend line, but failed to hold above the strong resistance level of $6400, where lies the 50 day moving average (the purple line).
- The next hours will be critical for Bitcoin to decide whether it will go back to the past week’s range between the two moving averages (50 and 200 days), or whether it will lose support, to re-test resistance levels at $6200 and $6100.
- Lurking in the background is the danger of the all-time yearly low at $5700 – $5800. Many eyes are locked on that area.
- Looking at the 4 hour chart, the Stochastic RSI indicator is about to cross down at its high level, which points to the market being overbought.
- Trading volume is getting higher, but still, not very significant levels.
- Resistance levels lie at $6400 and $6600 (with tough resistance along the 200 day moving average).
Bitcoin Prices: BTC/USD BitFinex 4 Hours chart
Cryptocurrency charts by TradingView. Technical analysis tools by Coinigy.
The post Bitcoin Price Analysis Sep.20: A Very Weird BTC behavior appeared first on CryptoPotato.