Bitcoin Price Analysis: Losing $4K in 24 Hours, Can BTC Hold the Critical Support Area?
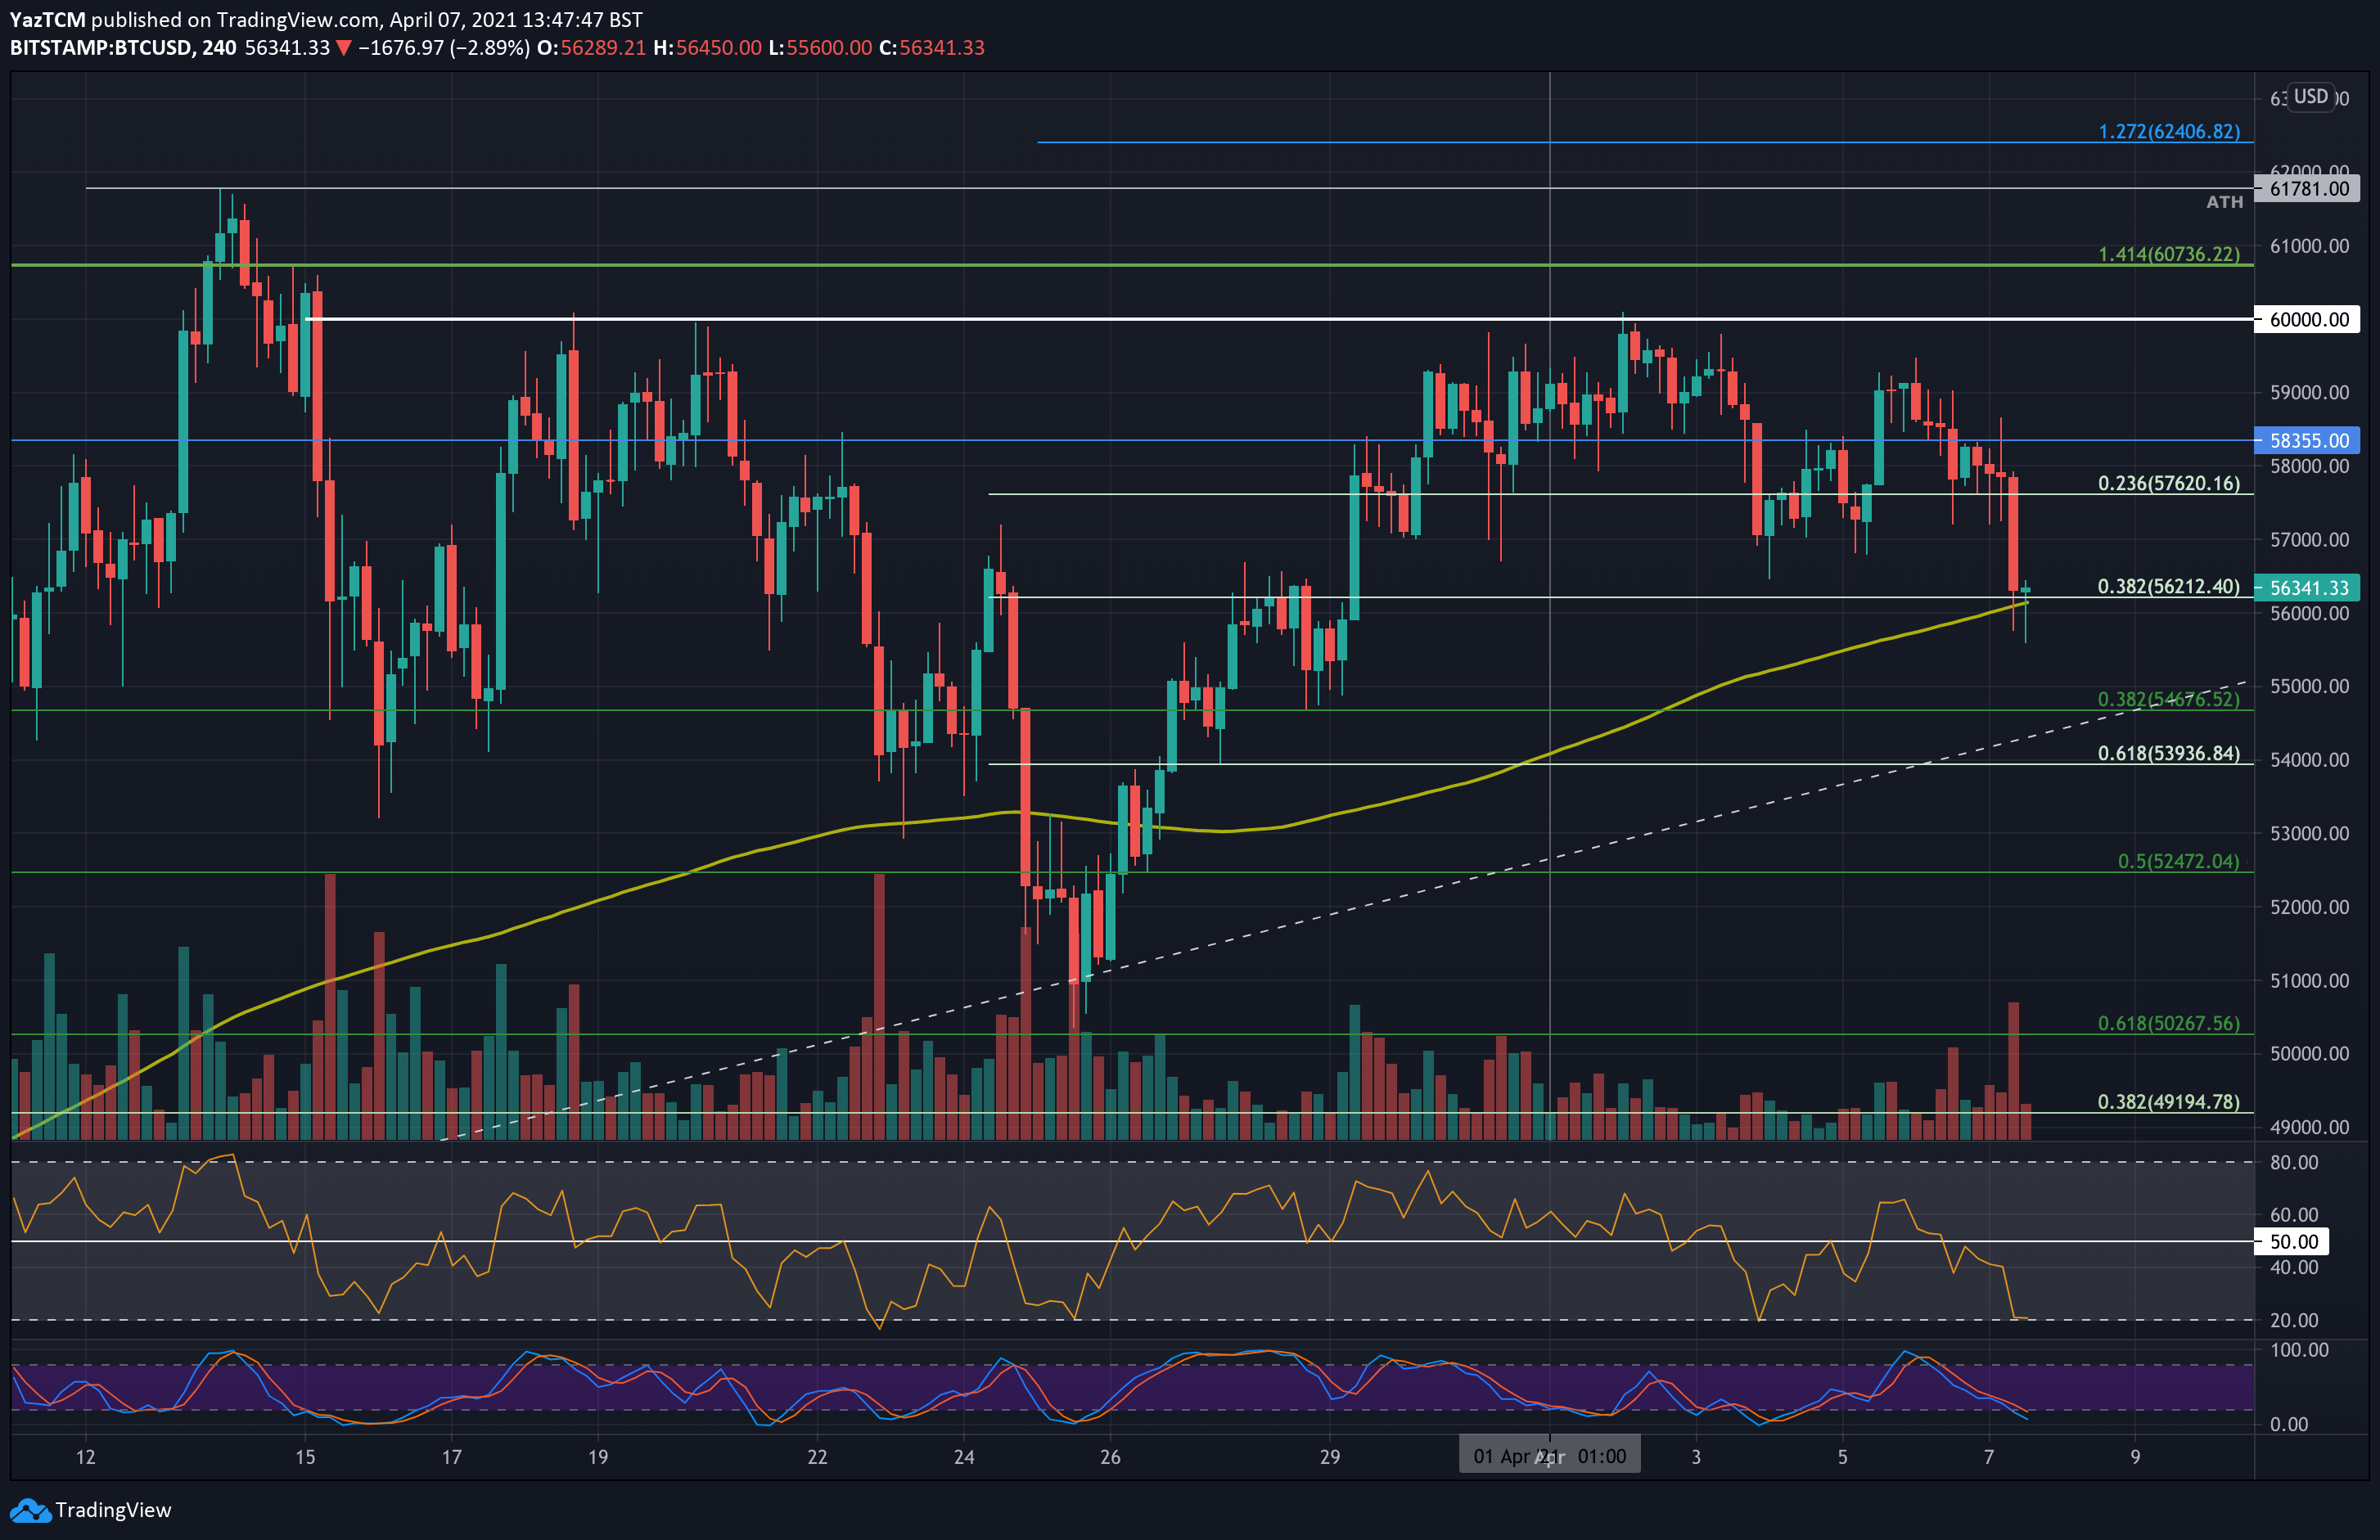
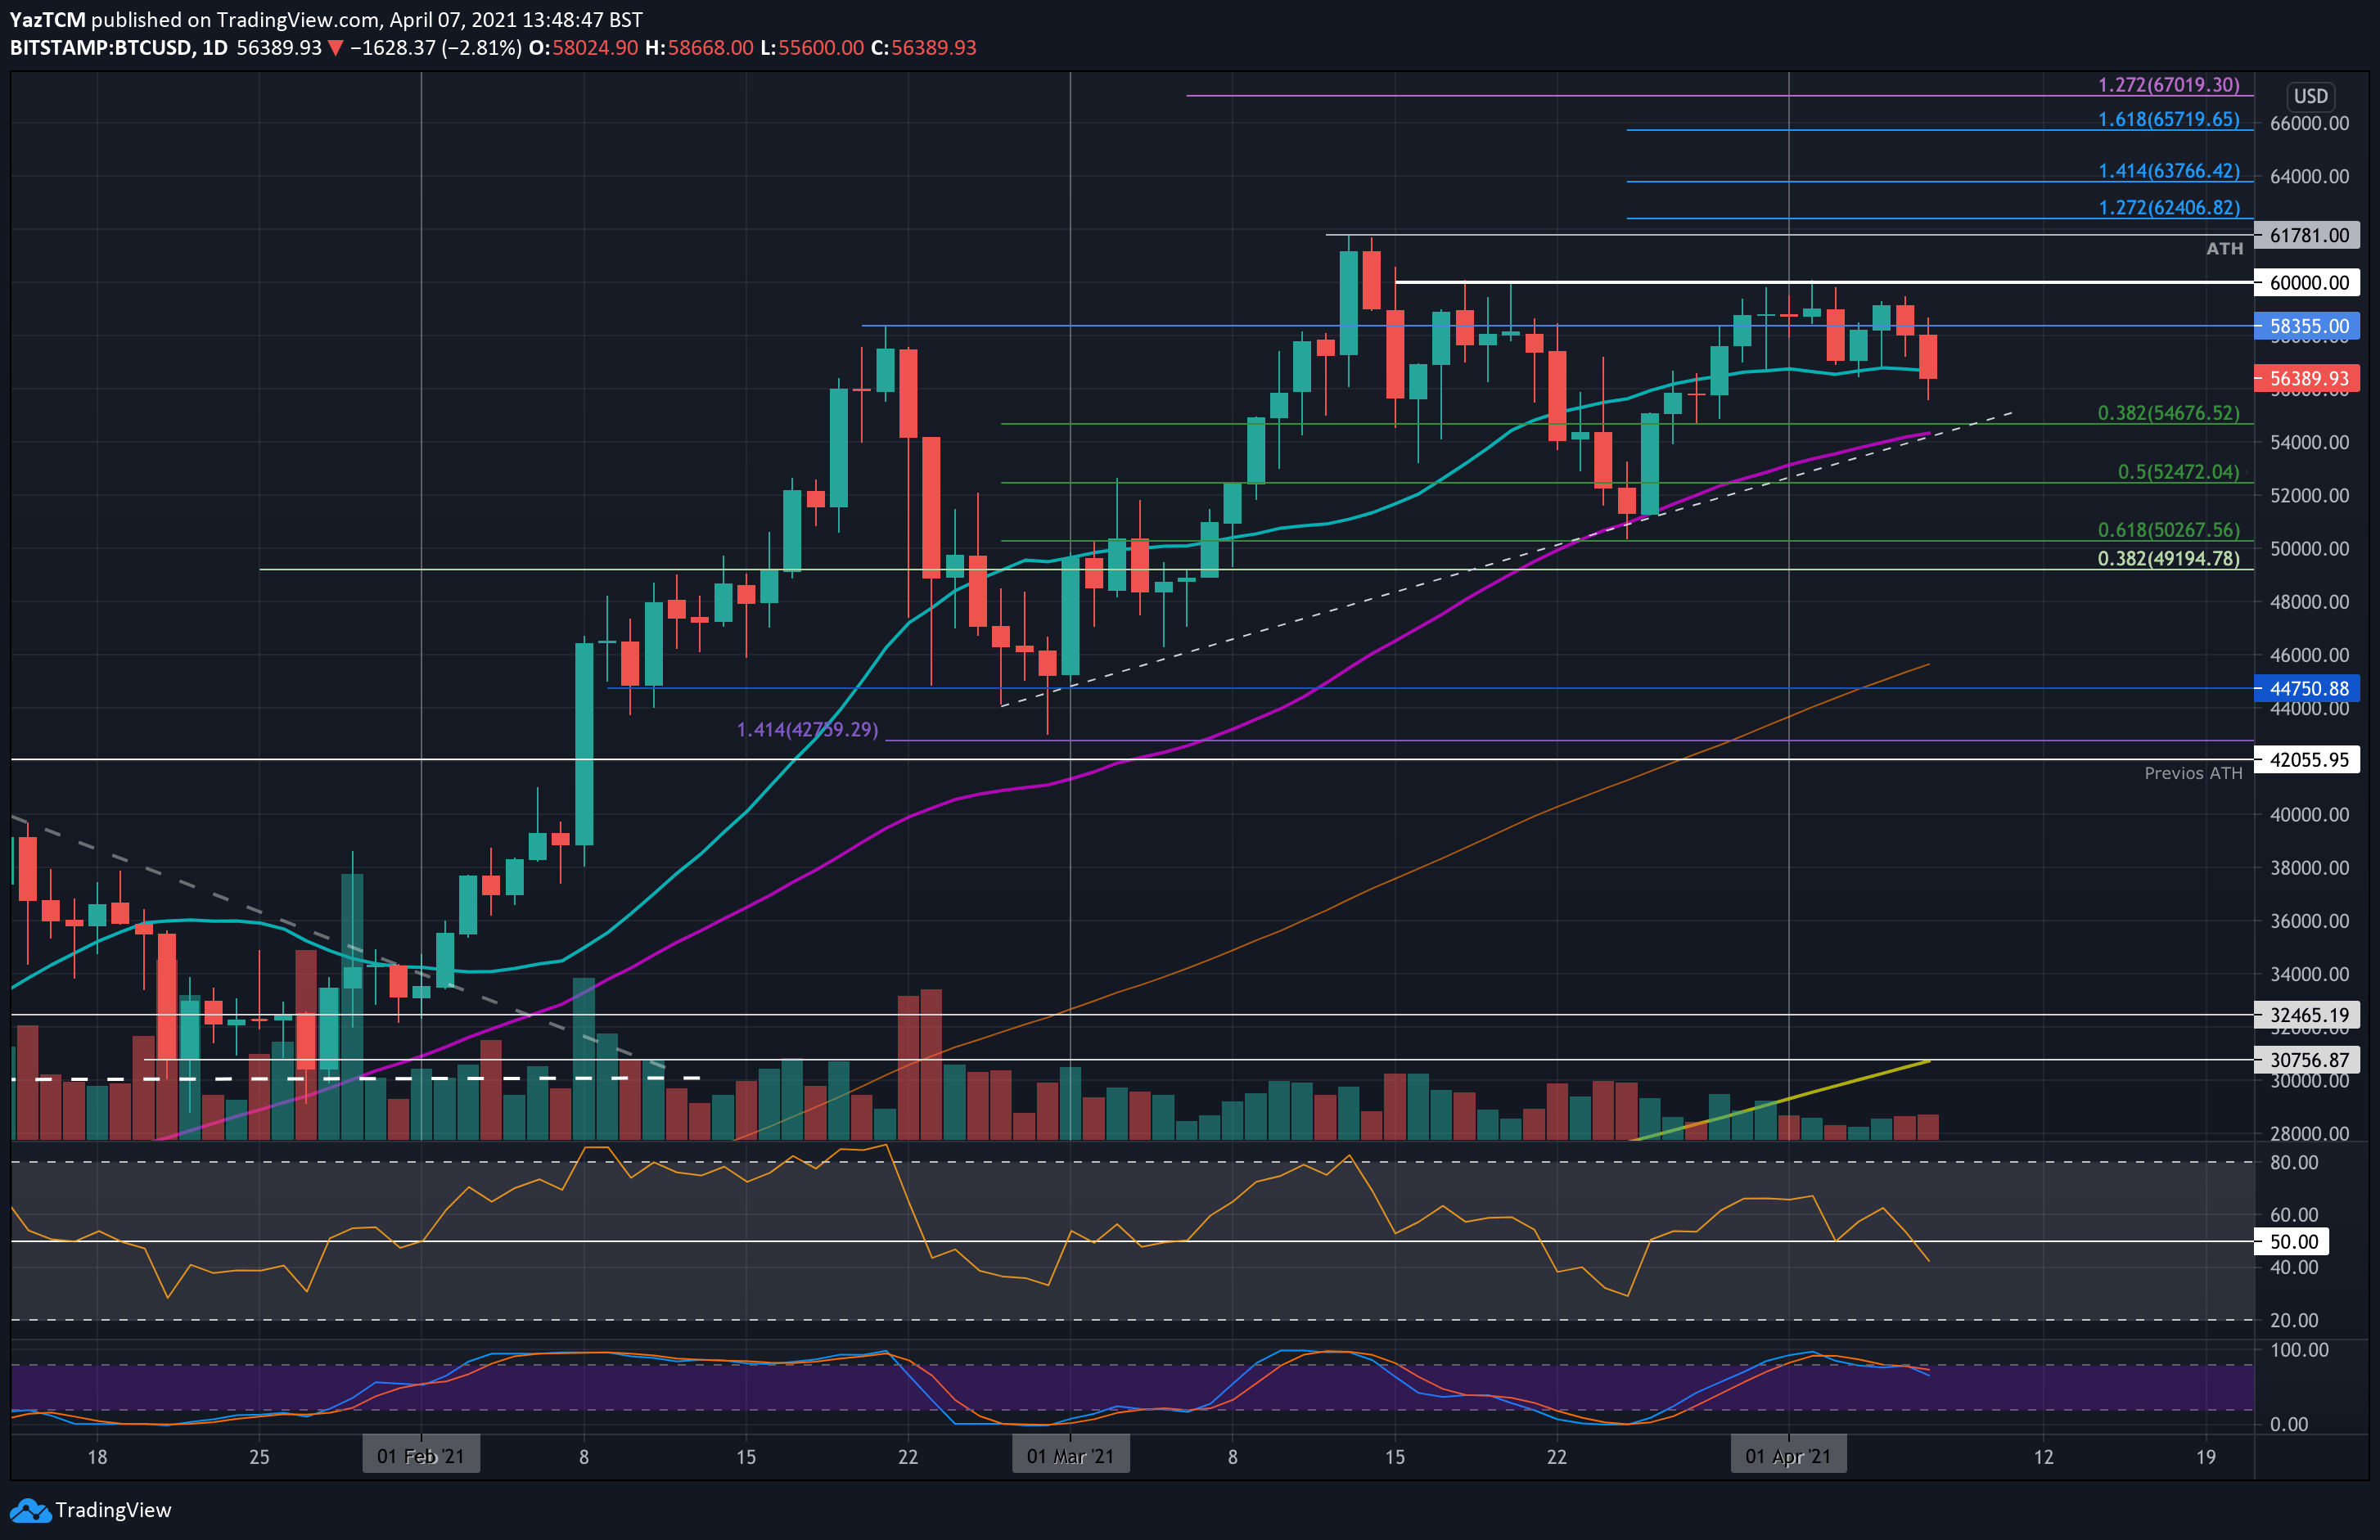
Bitcoin fell by a sharp 4% so far today as it dropped as low as $55,600. The cryptocurrency had started the month with another attempt to breach the $60,000 benchmark level. Unfortunately, it was unable to overcome this resistance through the week as it set a range between $60,000 and $57,000.
Today’s price drop caused bitcoin to break beneath this range as mentioned above. As of writing these lines, and as seen on the following 4-hour chart, it is currently holding the critical support around $56,200 – $56,100, provided by a short-term .382 Fib and a 4-HR 200 moving average line.
BTC Price Support and Resistance Levels to Watch
Key Support Levels: $56,200, $55,600, $55,000, $54,675, $54,200.
Key Resistance Levels: $58,355, $60,000, $60,750, $61,781, $62,400.
Moving forward, if the bears push back beneath the current support at $56,200 (MA-200 on the 4-hour chart), the first support lies at today’s low around $55,500 (which is also a descending trend-line started forming towards the end of January).
This is followed by $55,000, $54,675 (.382 Fib), and the critical level of $54,200 (50-days MA). This last support is further strengthened by an ascending trend line that has been in play since early March 2021.
On the other side, if BTC price will hold here, the first resistance now lies at the daily MA-20 around $56,800. This is followed by $58,355 (February highs), and the crucial area of $60,000. The latter had been rejected at least 5 times over the past month.
The daily RSI has now crossed beneath the midline, indicating bearish momentum has taken control within the market, in the short term. This comes after the RSI produced a bearish divergence signal earlier in the week as we mentioned here in the previous price analysis.
Bitstamp BTC/USD Daily Chart
Bitstamp BTC/USD 4-Hour Chart