Cardano Price Analysis: ADA Fighting to Defend Critical $2 Support
ADA/USD – Bulls Continue To Defend $2
Key Support Levels: $2, $1.88, $1.80
Key Resistance Levels: $2.60, $2.70, $2.80.
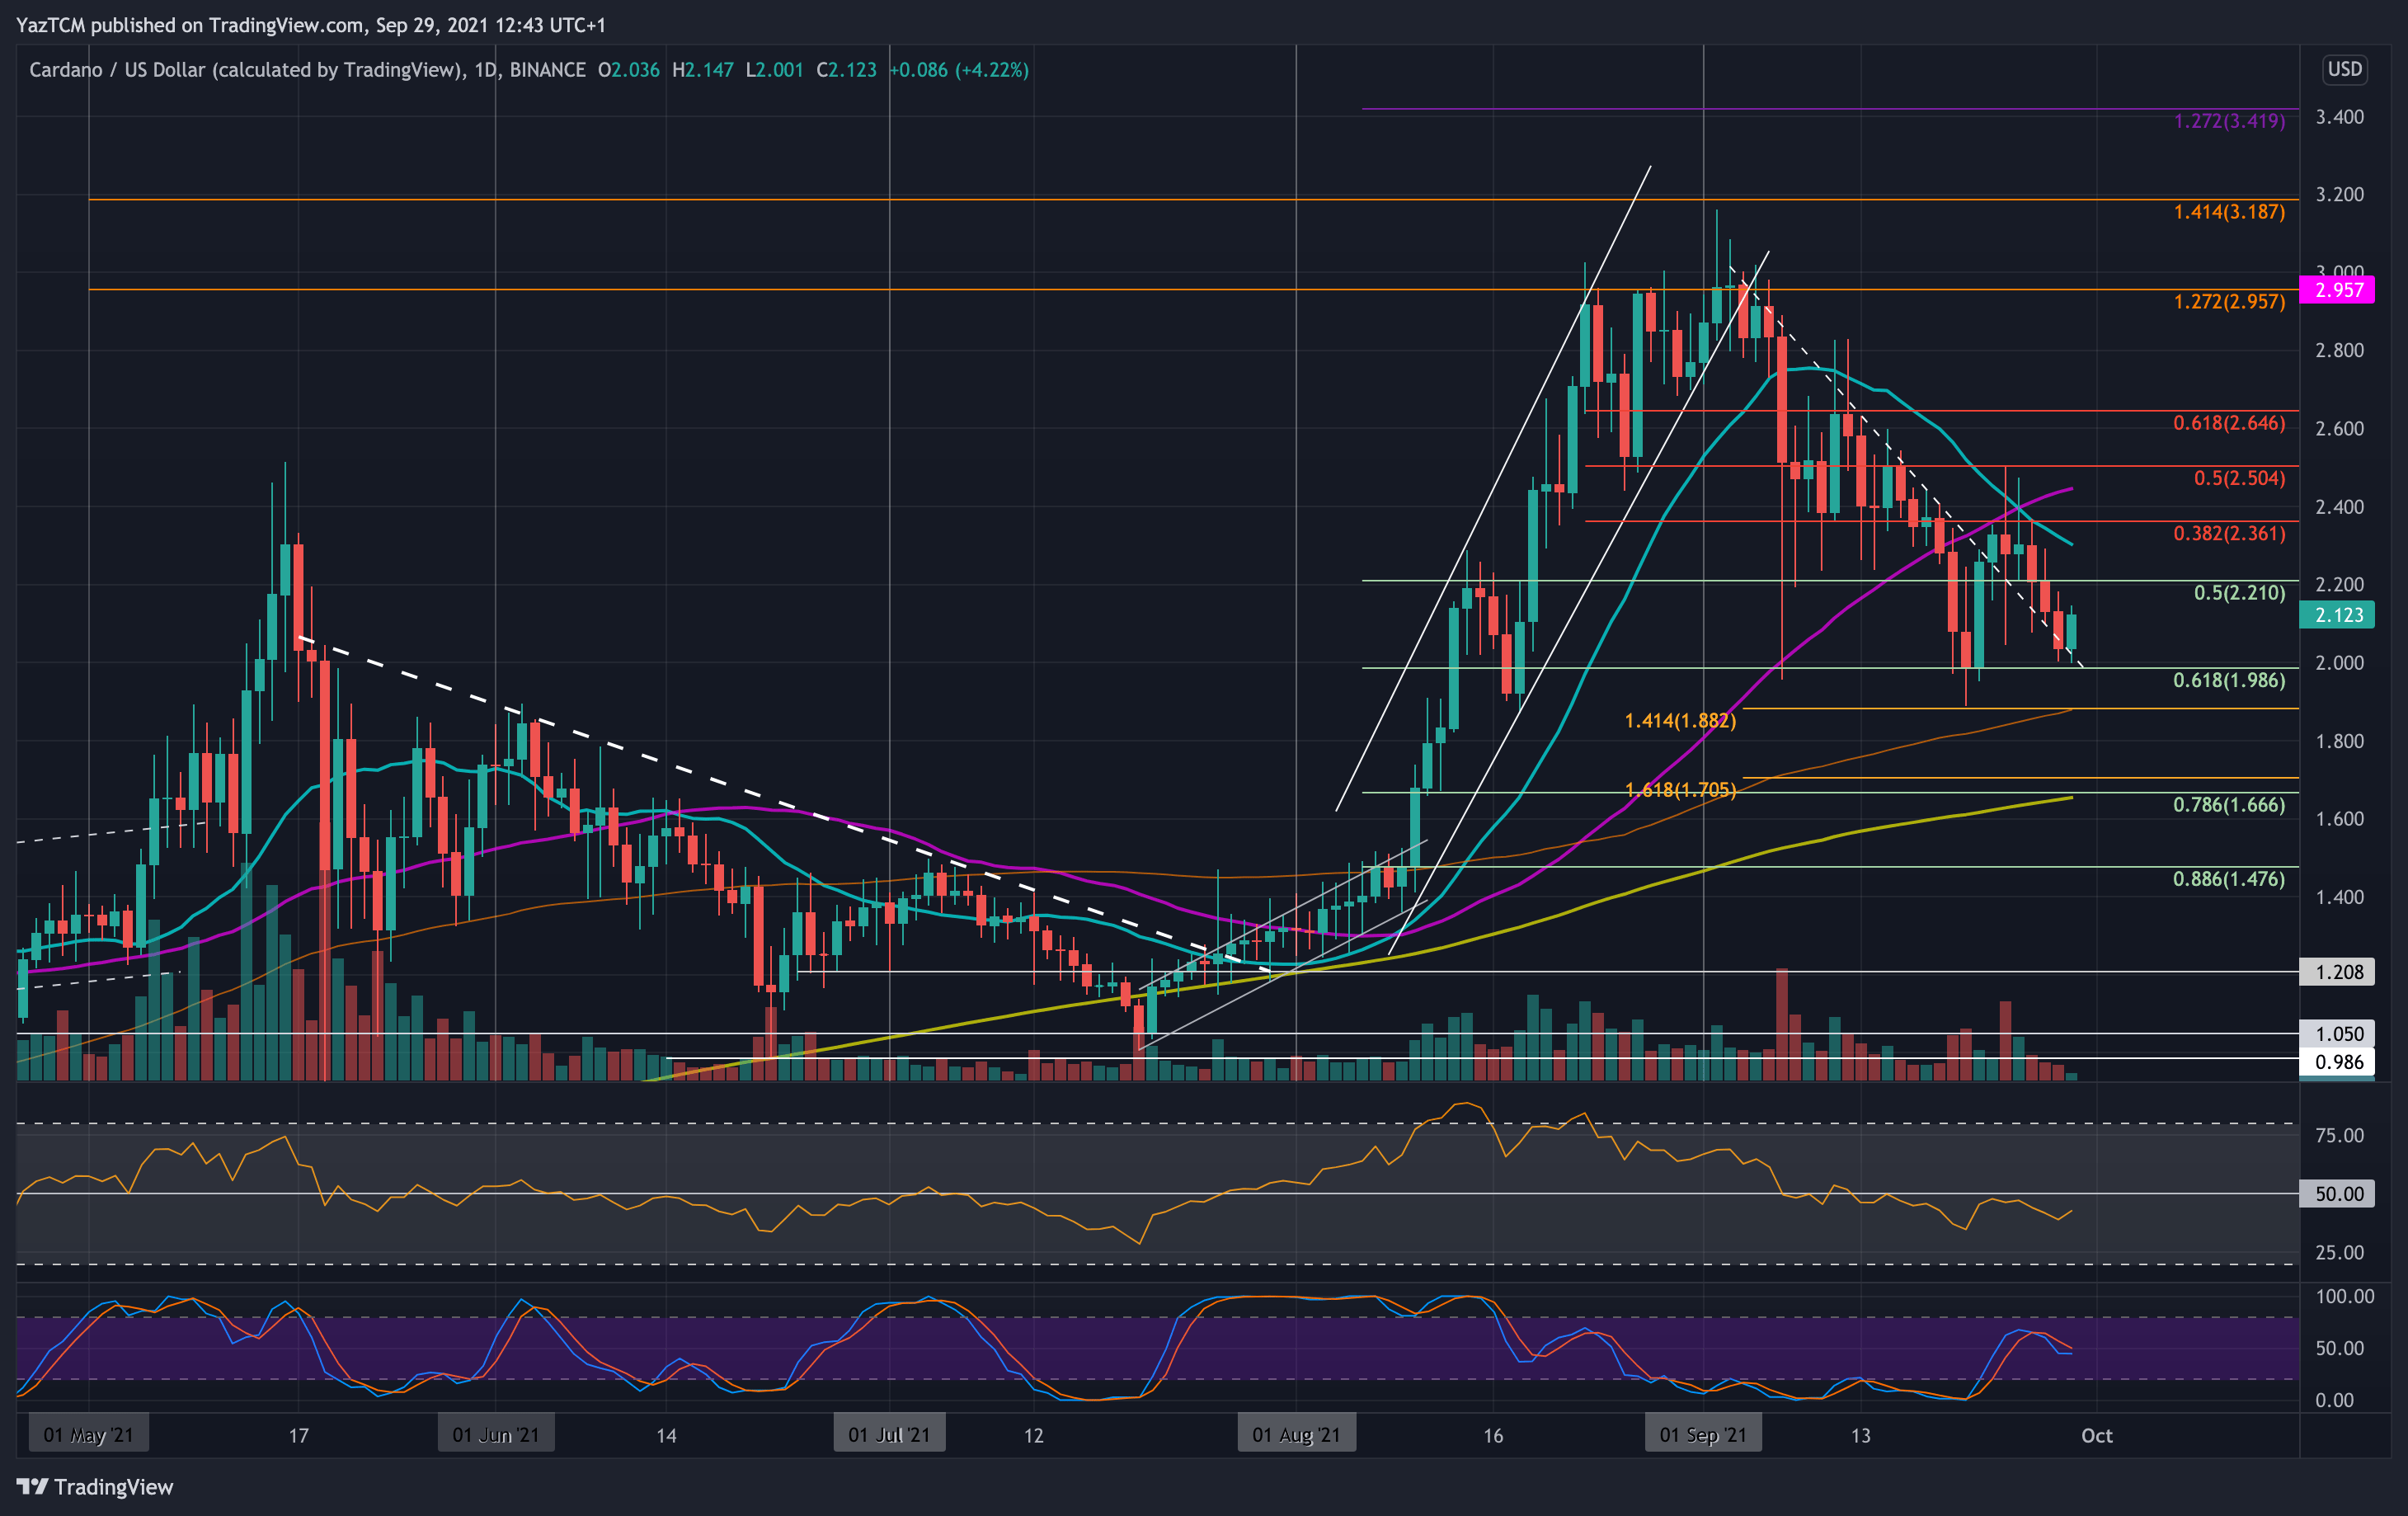
ADA found support at $2 last week, provided by a .618 Fib Retracement. From there, it rebounded through the week until resistance was met at $2.50 (bearish .5 Fib). Since hitting this level, ADA has rolled over and returned back to around $2.
ADA must this level throughout the week to prevent any further declines. It must also break the $2.50 resistance for a chance to recover back toward the September highs.
ADA-USD Short Term Price Prediction
Looking ahead, the first resistance lies at $2.20. This is followed by $2.30 (20-day MA), $2.45 (50-day MA), and $2.50 (bearish .5 Fib).
On the other side, the first strong support lies at $2 (.618 Fib). This is followed by $1.88 (downside 1.414 Fib Extension & 100-day MA), $1.80, and $1.66 (.786 Fib & 200-day MA).
The daily RSI remains beneath the midline, indicating weak bearish momentum in the market.
ADA/BTC – Bulls Struggle AT 5400 SAT Resistance.
Key Support Levels: 5000 SAT, 4800 SAT, 4715 SAT.
Key Resistance Levels: 5200 SAT, 5400 SAT, 5600 SAT.
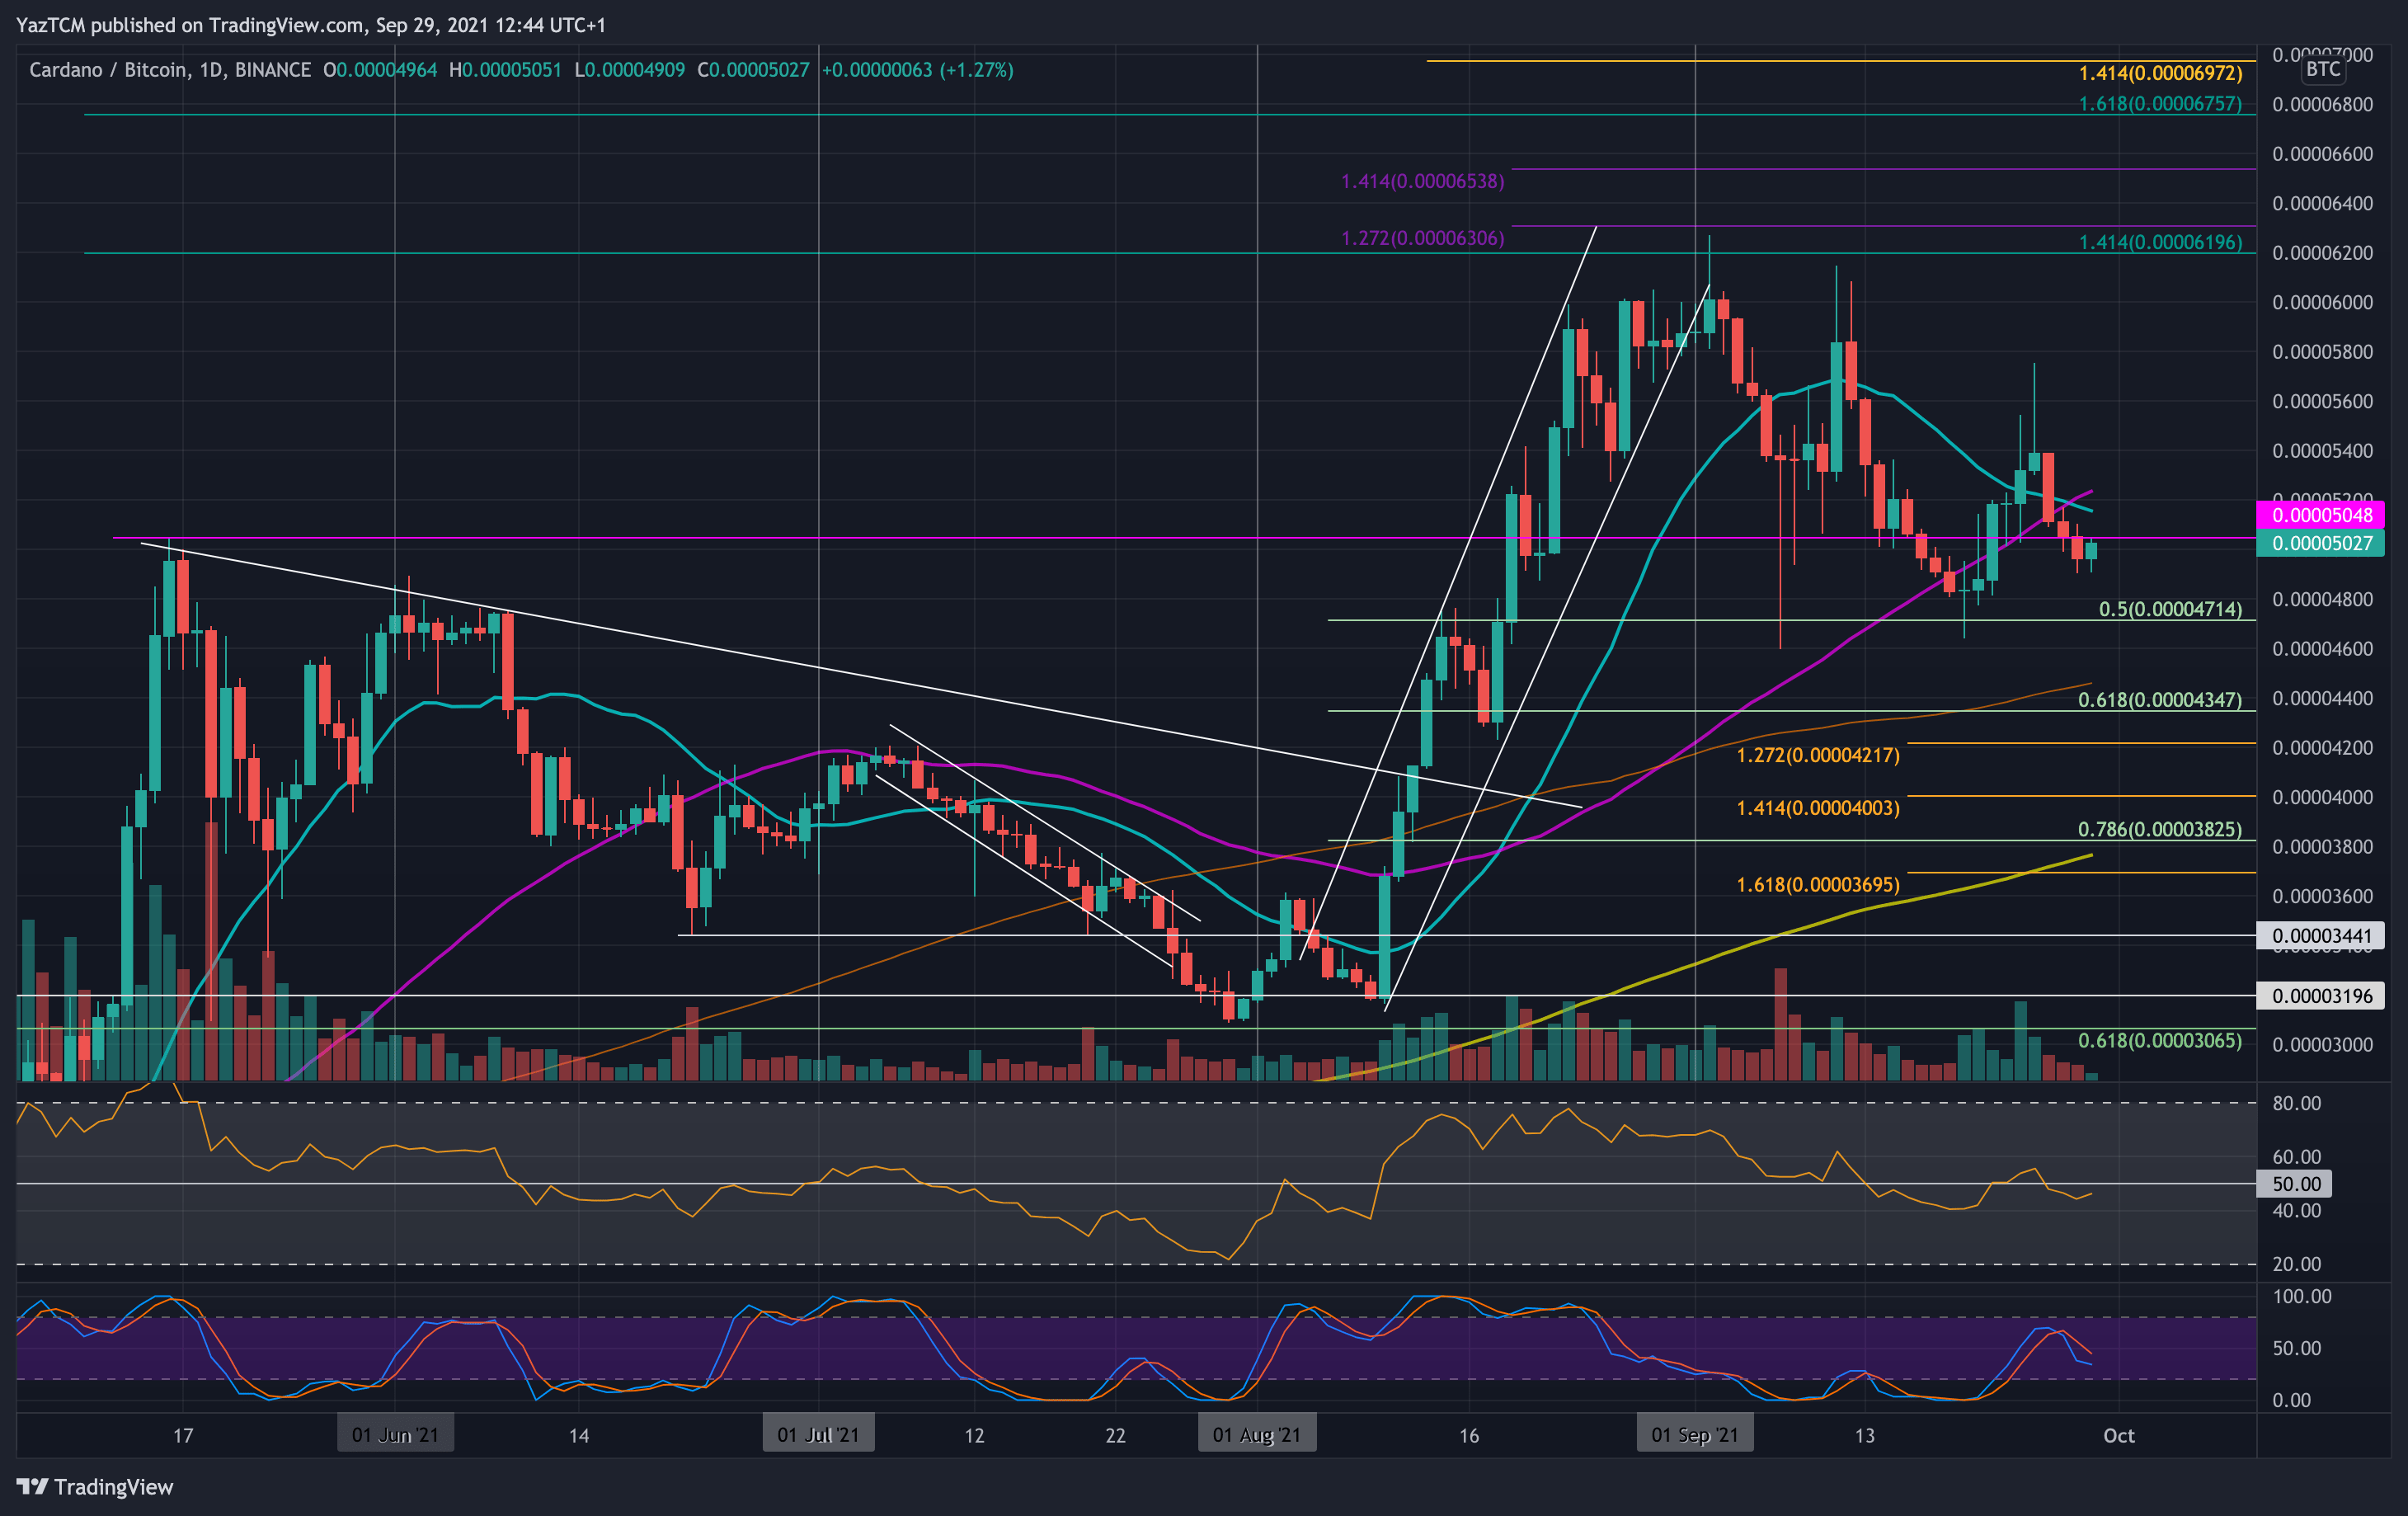
ADA rebounded from support at 4800 SAT last week and started to head higher. It managed to break back above the 50-day MA during the week but failed to close a daily candle above resistance at 5400 SAT.
As a result, ADA has dropped from the weekend resistance to fall back into the support at 5000 SAT today.
ADA-BTC Short Term Price Prediction
Moving forward, the first support lies at 5000 SAT. This is followed by 4800 SAT, 4715 SAT (.5 Fib), 4500 SAT (100-day MA), and 4350 SAT (.618 Fib).
On the other side, the first resistance lies at 5200 SAT 9(20-day MA & 50-day MA). Added resistance lies at 5400 SAT, 5600 SAT, 5800 SAT, and 6000 SAT.
The RSI is fluctuating around the midline, indicating indecision within the market.