Bitcoin Price Analysis July 27
So, since our previous Bitcoin price analysis, Bitcoin had gone wild – broke up the $8200 resistance, and the next resistance level at $8400 seems to become the Bitcoin’s party popper for now.
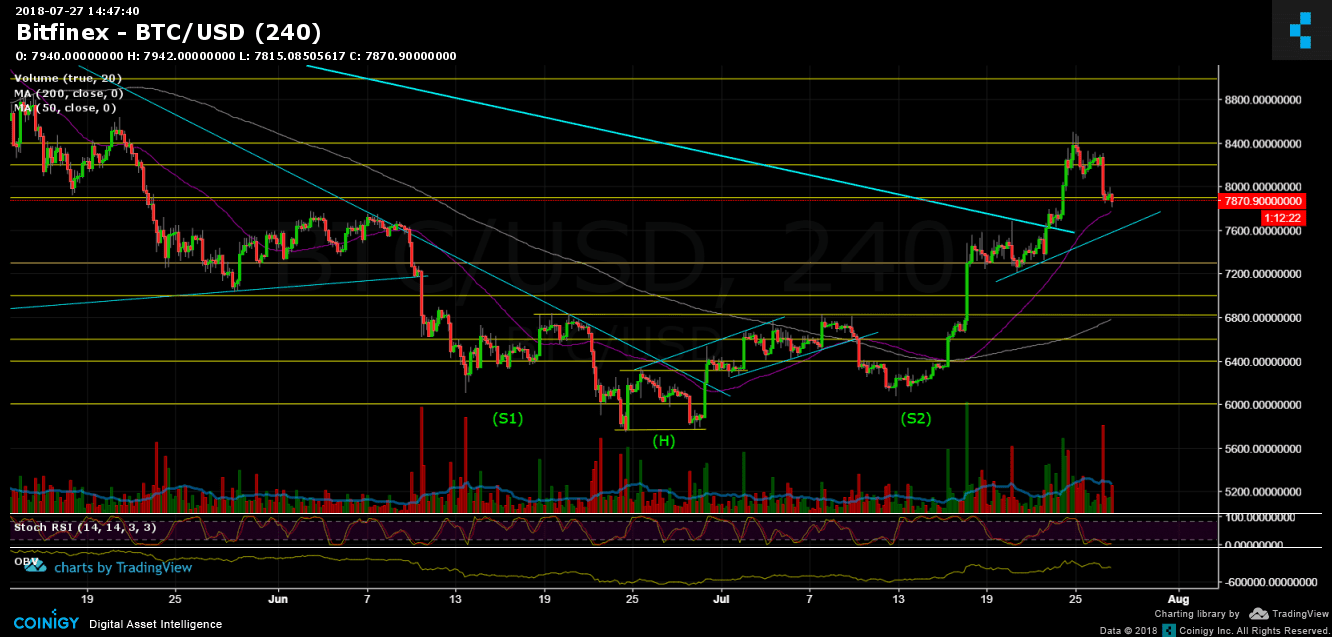
What comes fast – gets corrected even faster. that’s what we saw during the recent 24 hours. As seen on the following chart, BTC had reached resistance-turned support level at $7800. This might be a possible change of the negative momentum. The moving average 50 days also lies around that area and might help to support Bitcoin.
Also, RSI levels are very low, which is a positive sign (market is oversold).
To sum up: Support levels lie at $7800, $7600 (Fibonacci retracement %38.2 of the 1 Day chart) and $7300.
Resistance levels lie at $8200, $8400 and $9000 (which is our closest target to current bull run).
Bitcoin Prices: BTC/USD BitFinex 4 Hours chart
The post Bitcoin Price Analysis July 27 appeared first on CryptoPotato.