Bitcoin Price Analysis: Market Showing Signs of a Bull Move Back to $10,000
Following our previous analysis and over the past week, there has not been much price action in the Bitcoin market.
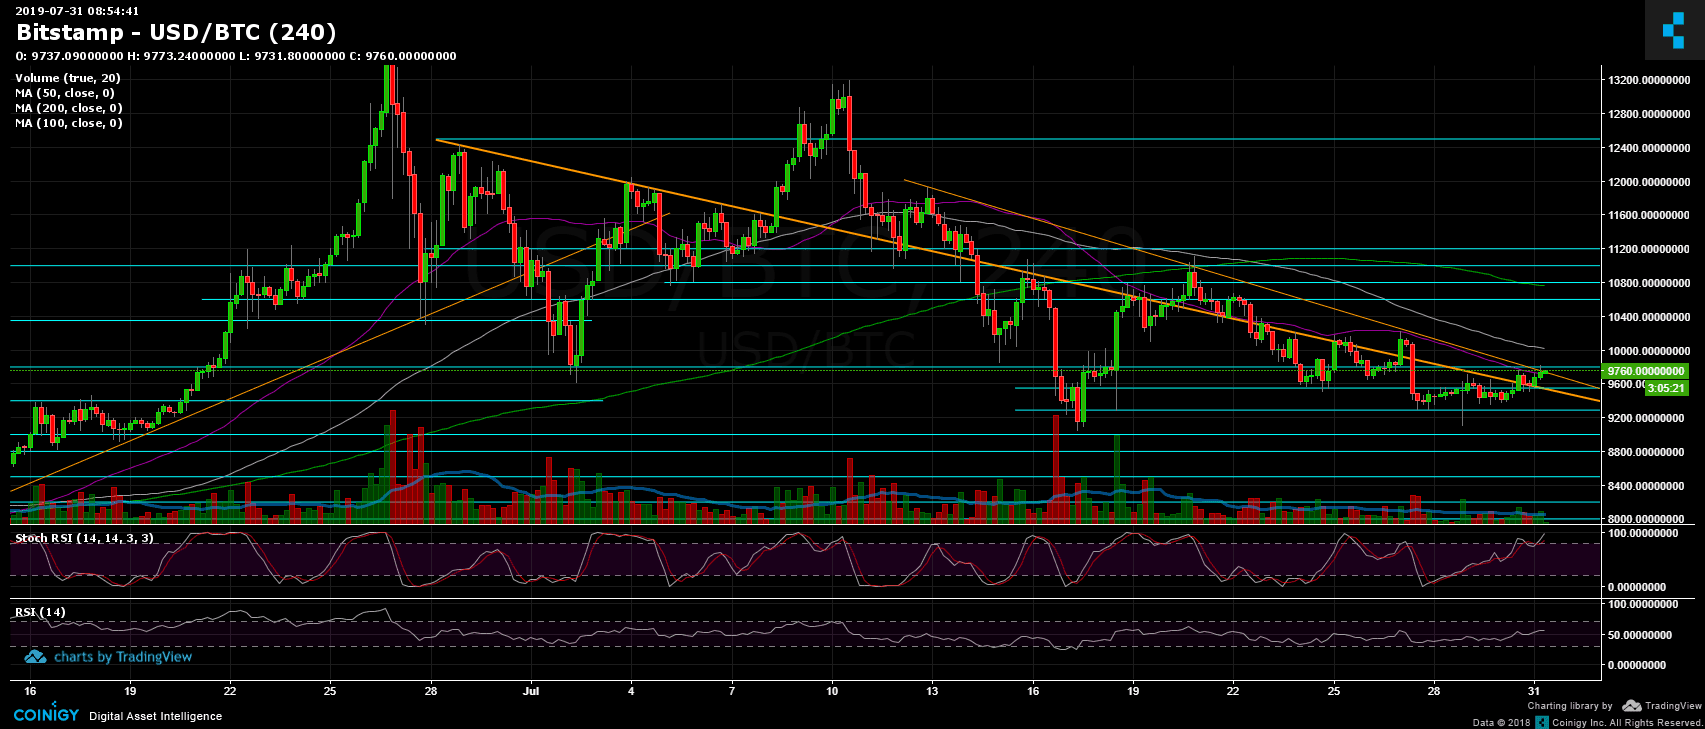
The price of the coin is still hovering in the range of $9,400 to $9,800. However, following another bearish leg down, we saw Bitcoin get quickly bought around the $9,000 region. The daily chart has been forming a decent double bottom ($9,000) bullish formation.
Looking at the RSI, the significant momentum indicator turned around at the 40 support level and is now facing the 45 support-turned-resistance line, but it’s still far from the bullish area (above 50). Will it maintain the supporting floor at 40?
Another bullish sign might come from the Stochastic RSI oscillator which crossed over from oversold territory after being there for the entire past month. The oscillator is about to enter the bullish area.
From the fundamental side, yesterday’s congressional hearing passed without much action, and today the global economy is facing one of its most critical days, with an expected cut in interest rates. That could have an effect on the cryptocurrency markets in the longer term.
To sum it up, there are always two sides: While the support at $9,000 seems strong, we could always go below it and break the aforementioned double bottom formation. Bitcoin hasn’t been able to overcome the resistance line provided by the 50-day moving average (marked in purple on the 4-hour chart) over the past ten days, and as of now, it is taking another shot.
Total Market Cap: $270 billion (according to CoinGecko)
Bitcoin Market Cap: $174 billion
BTC Dominance Index: 64.6%
Key Levels to Watch
Support/Resistance: From the bullish side, Bitcoin is now facing the $9,800 – $10K resistance zone. In the case of a break up, the $10,5000-$10,600 old support-turned-resistance area seems solid combined with the 50-day moving average line. Further above is $10,800 before the $11,000 resistance.
From below, the nearest support area lies around $9,550. Further below is the $9,300 level, before the double bottom at $9,000, which is the lowest point of the recent parabolic move. In the case of a break down, lower support areas can be found in the $8,500-$8,800 region (along with the 100-day moving average line).
– Daily chart’s RSI: Discussed above.
– Trading Volume: As mentioned above, the trading volume has decreased to very low levels that are far from the recent monthly average. The last three days saw particularly low volume.
BTC/USD Bitstamp 4-Hour Chart
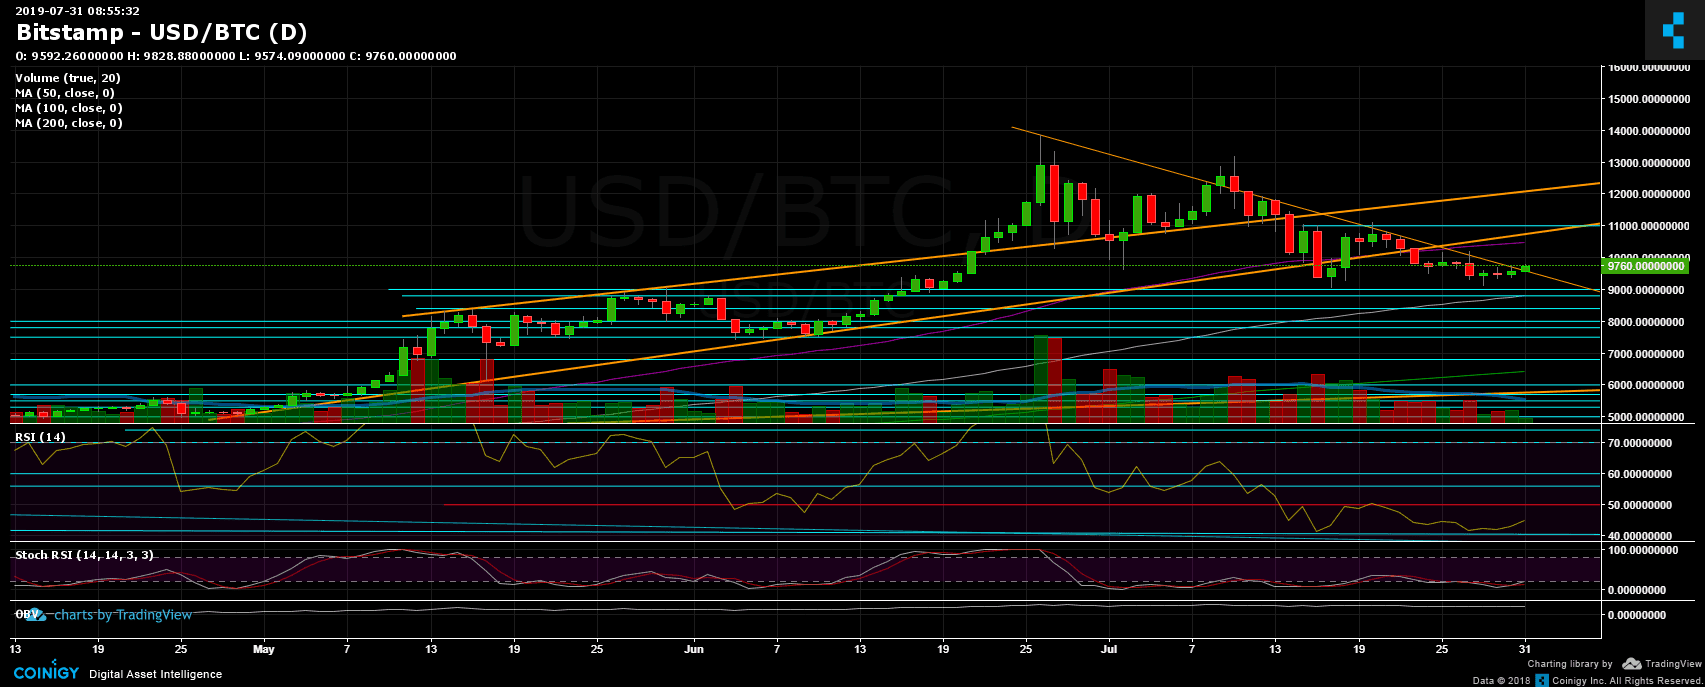
BTC/USD Bitstamp 1-Day Chart
The post Bitcoin Price Analysis: Market Showing Signs of a Bull Move Back to $10,000 appeared first on CryptoPotato.