Bitcoin Price Analysis Jan.3: BTC Is Facing a Tough Long-Term Resistance (MA-50)
Over the past two days since our last update, we can carefully say that 2019 is doing well to the cryptocurrencies: Led by Ethereum, most of the altcoins saw nice gains, while Bitcoin is (again) on the upper side of the $3700 – $3850 remarkable range.
Bitcoin broke up all the three moving average lines – 50, 100 and 200 days (4-hour chart) in its way to mark $3918 as the current daily high.
Looking at the 1-day & 4-hour charts
- On the following 4-hour chart we can see the decent breakout of the descending trend-line around $3710 (marked in orange).
- However, Stochastic RSI oscillator (4-hour) has crossed over at the overbought area. For the next hours, Bitcoin might visit lower support levels, maybe to gain power for a possible future mini-rally.
- Support areas might be $3800 (strong support along with the ascending line, MA-100, and MA-50), $3700 (along with MA-200 – marked in green) and $3600 (prior low).
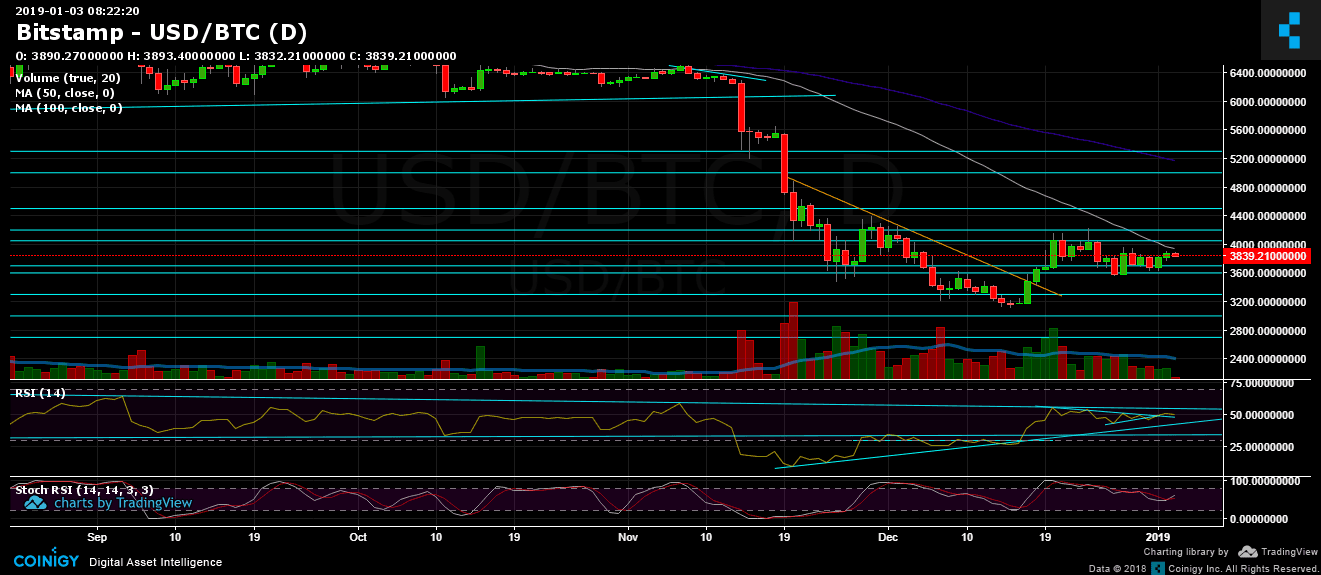
- From the bull side, $3950 is the prior high from a week ago. This level shouldn’t be easy for Bitcoin to bypass since it’s where lies the 50 days moving average line from the daily chart (marked in white on the 1-day following chart).
In case that $3950 breaks up, the next resistance area is $4050 – $4200. As a reminder, there is still a possibility for a bullish formation of an inverse Head and Shoulders pattern (with targets around $5000 in case of a breakout above $4200). - The trading volume is still very low. This is likely because of the new year holidays.
- There was not much change in BitFinex’s open short positions, which had slightly increased to 32.8K BTC.
BTC/USD BitStamp 4-Hour chart

BTC/USD BitStamp 1-Day chart
The post Bitcoin Price Analysis Jan.3: BTC Is Facing a Tough Long-Term Resistance (MA-50) appeared first on CryptoPotato.