SOL Explodes 35% in a Week, Here’s The Next Target (Solana Price Analysis)
The buyers stepped in for Solana as they managed to take the cryptocurrency above $44.
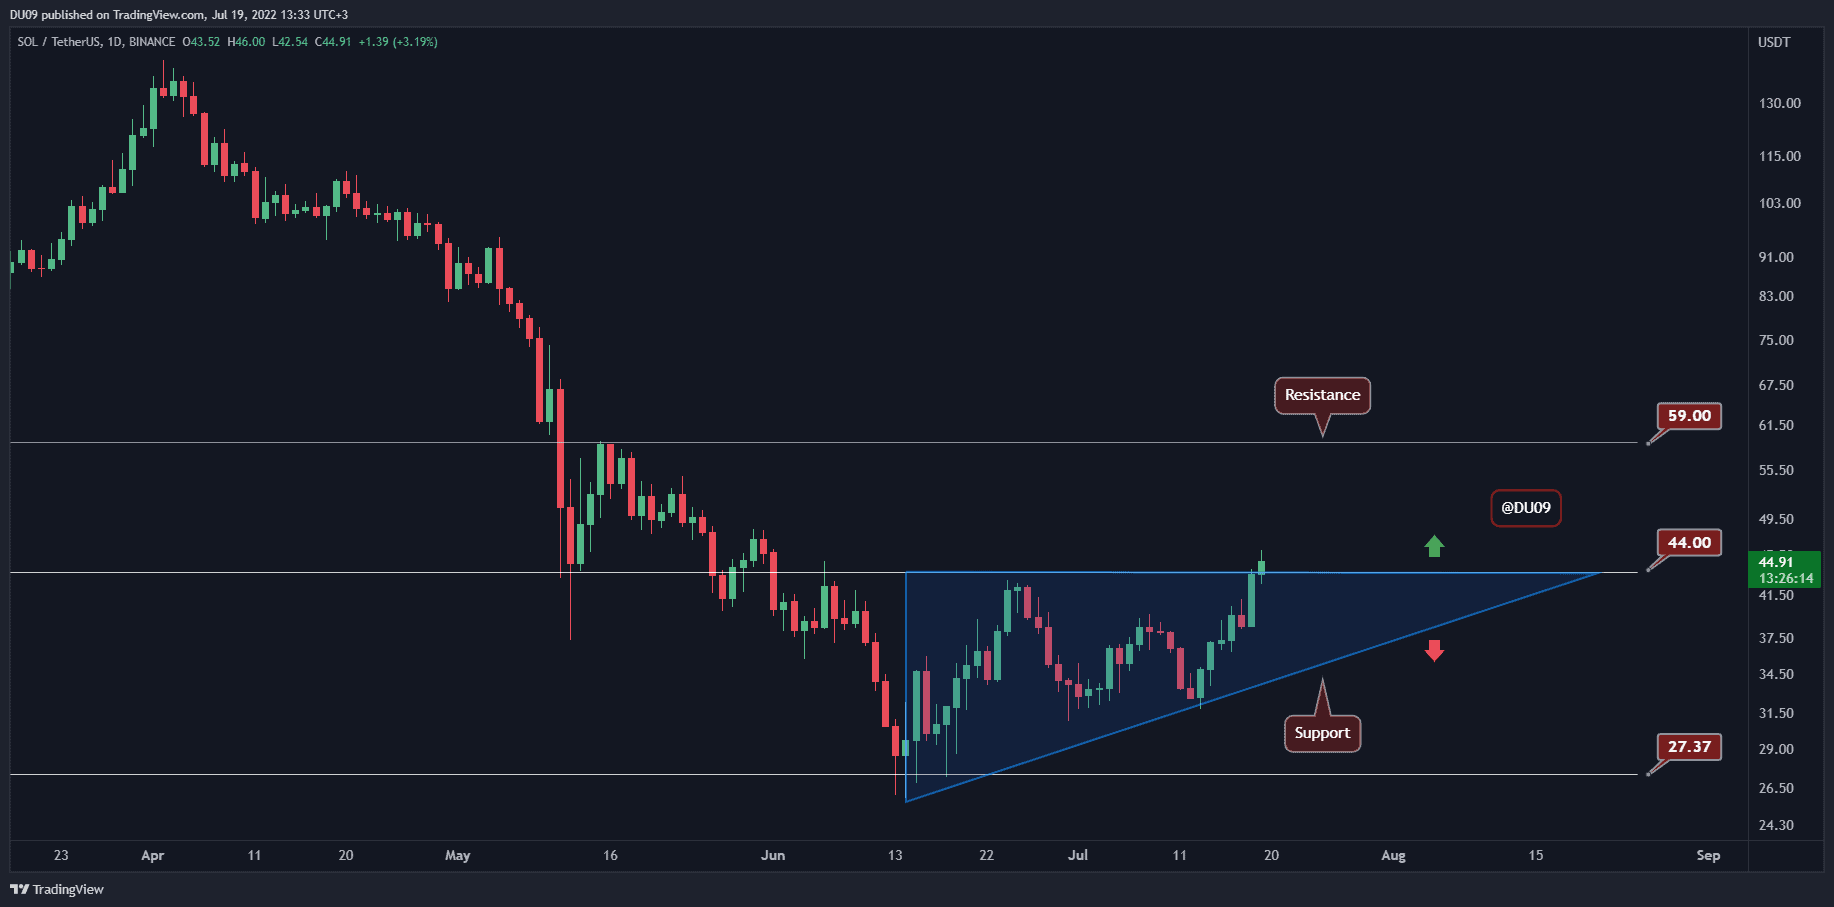
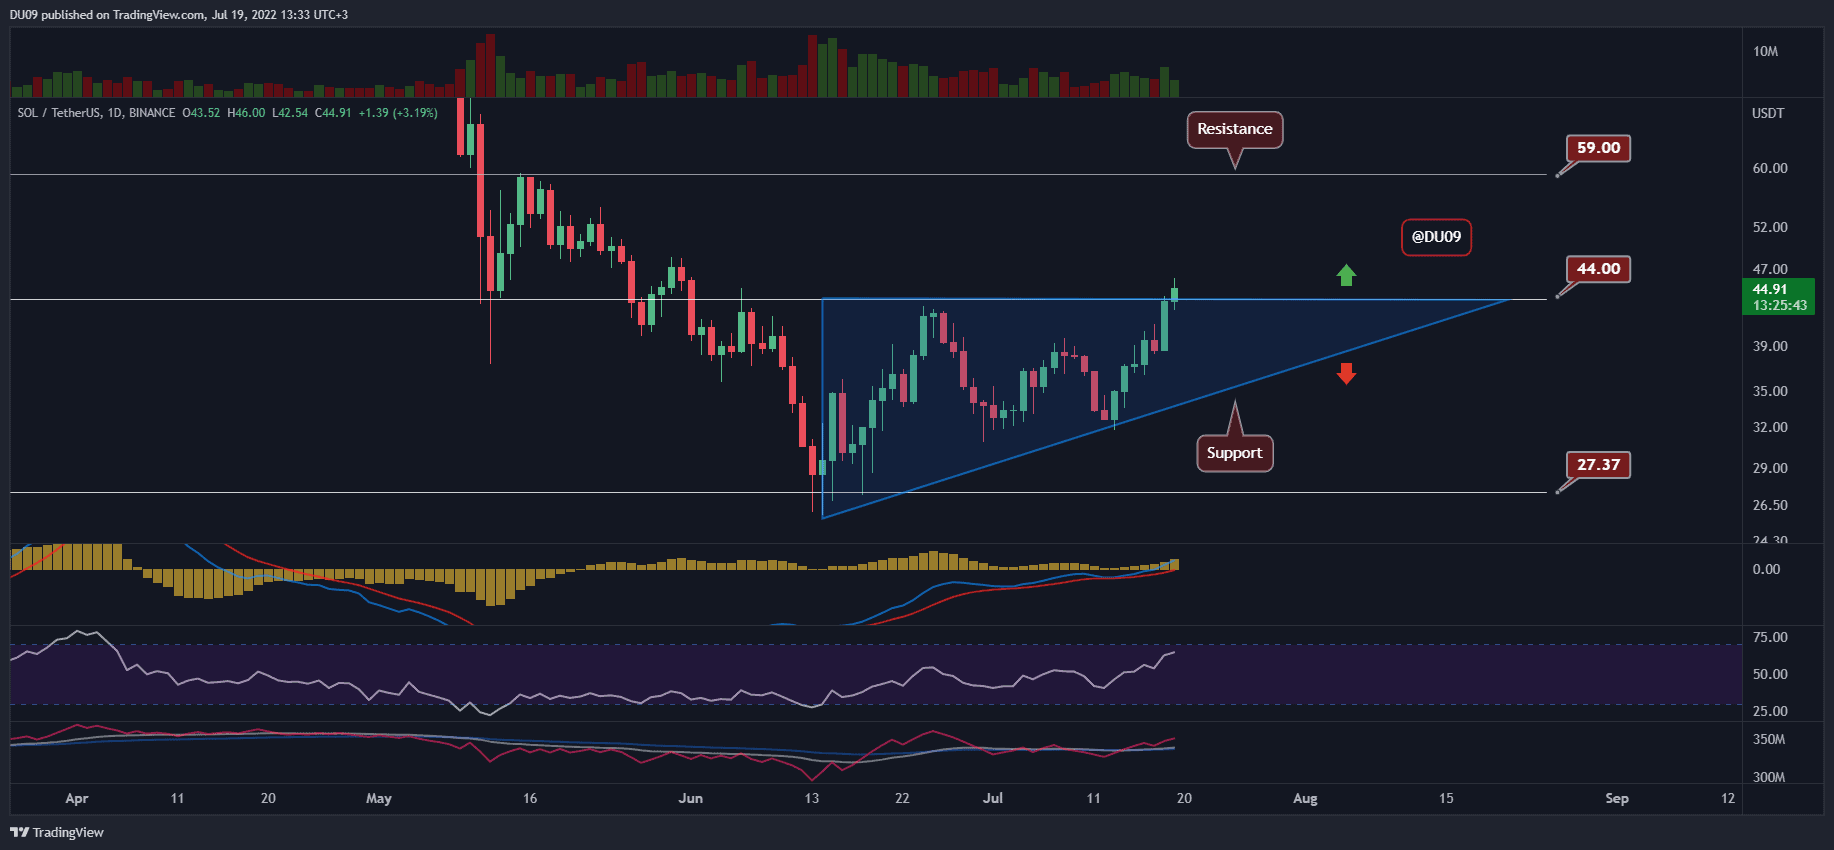
Key Support levels: $44
Key Resistance levels: $59
Solana managed to break the key resistance at $44 and turned it into support. In doing so, SOL surged past the ascending triangle, which is now being tested as support. If this level is maintained for the mid-term, then the path to $59 becomes easier.
Technical Indicators
Trading Volume: The buying volume increased sharply yesterday, which allowed the price to rally all the way to $44. Today, buyers were a bit timider but still managed to push SOL above this key level.
RSI: The daily RSI exploded higher and is not closing in to 70 points which would place it in the overbought area. This is bullish.
MACD: The daily MACD is bullish with expanding moving averages and histogram. The momentum favors bulls right now, and there are no signs of weakness.
Bias
The short-term bias for SOL is bullish.
Short-Term Prediction for SOL Price
Solana just flashed a considerable change in its mid-term trend with this latest breakout. If the buyers manage to keep its price above $44, then they will likely have total control of the market momentum – at least until the next key resistance at $59.