Bitcoin Price Analysis Jan.17: More BTC Sideways Action, Decision Soon To Be Made
Over the past 24 hours since our previous price analysis, Bitcoin has been moving sideways, with not much of a change.
However, as time goes by and buyers are not showing up, weakness can be witnessed around Bitcoin. Some other signs could also signal on a higher chance for a coming up breakdown following these sideways movements.
Looking at the bigger picture for the short-term: from above, the $3700 serves as a key-resistance including the daily 50 days moving average line along with resistance line. From below there is the $3480 – $3500 area, which is the weekly low.
Both mentioned resistance and support levels were tested twice during the past week. We can assume that the next time the levels will be tested we will see a breakout in that direction. As of now, it seems more likely that $3500 will be tested next, but in crypto, you never know.
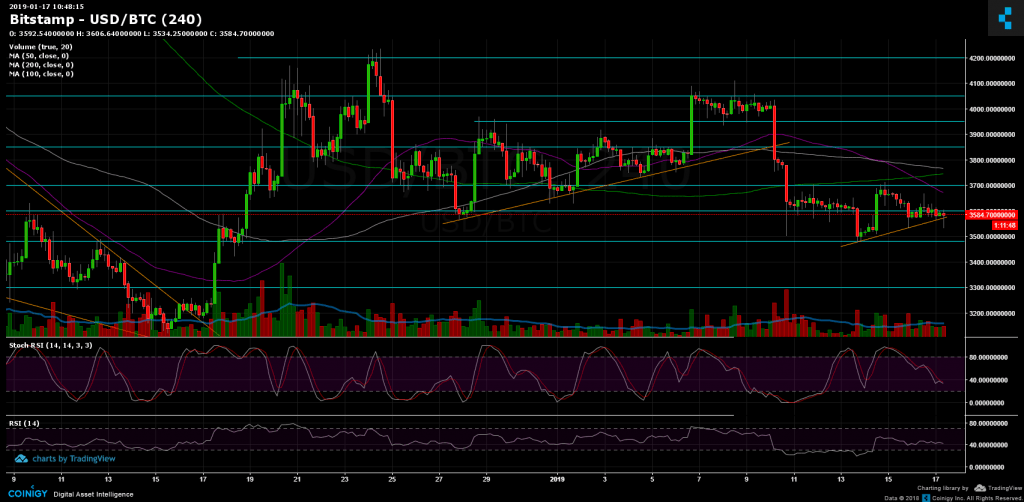
Looking at the 1-day & 4-hour charts
- As said before, from above, the next resistance levels are $3600, $3700 (MA-50 1-day chart), $3750 (4-hour MA-50 and MA-100) and $3850.
- From below Bitcoin is getting supported by an ascending trend-line nearby, before the $3480 – $3500 weekly low. The next support levels lie at $3400 and beyond – $3300.
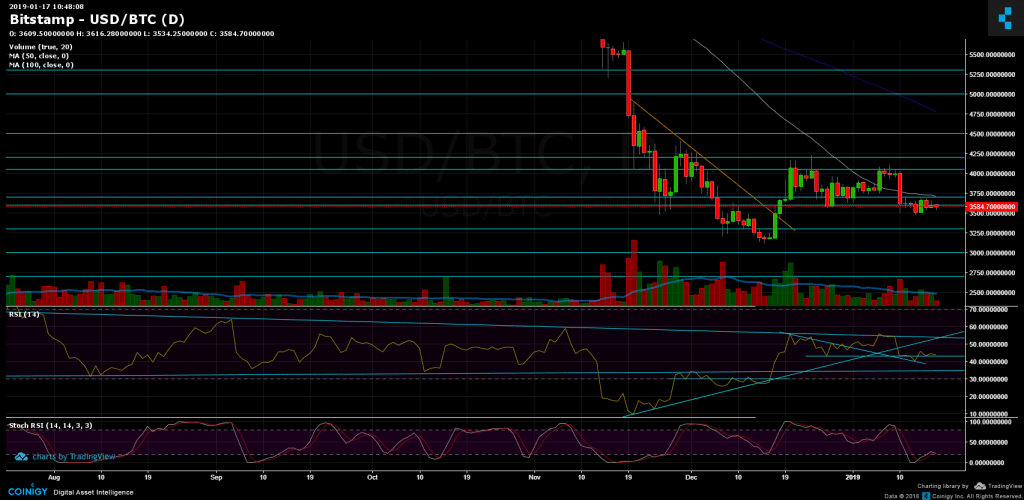
- The Daily Chart: The RSI indicator is still on top of the major support line at 43. This could be a positive sign unless it will break down shortly.
- As sideways action goes by, the trading volume is very low.
- I’ve promised signs of weakness, so looking on BitFinex’s open short positions, the open positions (21.9K) are at their lowest point since Nov.18, while long positions are slowly climbing up. As we know, this is usually a set-up for a long squeeze. The last time we’ve seen this set-up occurred seven days ago when Bitcoin ended up dropping more than 10% on that day (losing the $4000 support, recording a daily low at $3503 Bitstamp).
BTC/USD BitStamp 4-Hour chart
BTC/USD BitStamp 1-Day chart
The post Bitcoin Price Analysis Jan.17: More BTC Sideways Action, Decision Soon To Be Made appeared first on CryptoPotato.