Bitcoin Price Analysis August 2
From our previous Bitcoin price analysis: “BTC expecting to produce a fast move to either direction, this is expected to take place in the following 1-2 days.”
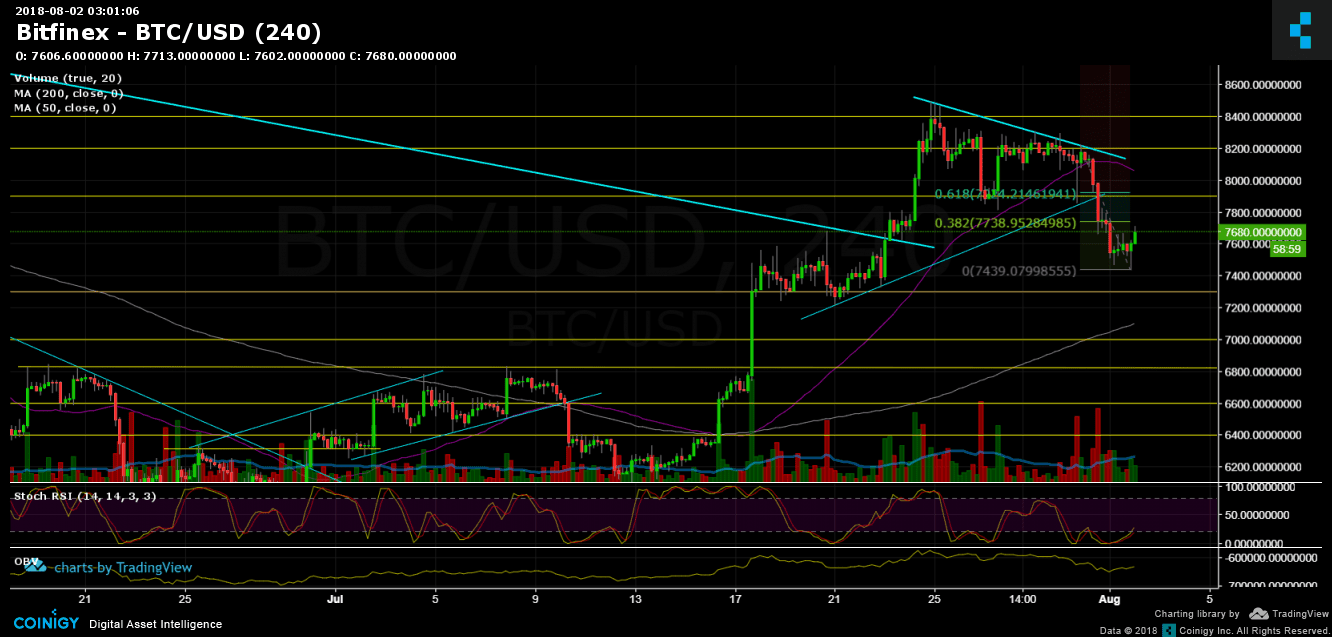
As you all might have seen, the direction was down. The range between $7800 – $8200 had been broken down, the Moving Average 50 days was broken down as well (the last time Bitcoin was below MA-50 was at $6300) the support at $7600 also broke, and the low has been recorded at $7440 (BitFinex). The trigger this time was the hacking of Bithumb.
During recent hours, we see a correction to the decline. According to the chart and to Fibonacci levels – the correction might reach $7700 area (38.2% level) or $7900 zone (61.8%). The overall picture looks negative – the very high seller’s candle also point on that, but all can be changed in case of breaking up the $8000 level again (followed by a decent green trading volume) – where lies the important Moving Average 50 days (purple line in the chart).
To sum up: Support levels lie at $7600 and $7300.
Resistance levels lie at $7800- $8000 zone, $8200.
Bitcoin Prices: BTC/USD BitFinex 4 Hours chart
The post Bitcoin Price Analysis August 2 appeared first on CryptoPotato.