XRP Testing Crucial Resistance, is $0.5 in Play? (Ripple Price Analysis)
Bitcoin’s price has been trending upward lately, while Ripple has remained relatively stable, staying around the same level without much movement. However, XRP is currently showing signs of strength as it has surpassed a significant resistance level.
Technical Analysis
By Shayan
The Daily Chart
This week, the cryptocurrency market experienced a bullish trend, with assets such as Bitcoin and Ethereum witnessing a significant price increase. However, Ripple was an exception as it continued consolidating without any clear direction.
Nevertheless, after a prolonged consolidation stage at the narrow range of the triangle, the price has finally printed a surge and surpassed the triangle’s upper boundary and the 200-day moving average at roughly $0.3997.
On the other hand, the cryptocurrency faces significant resistance at the $0.44 price region. If XRP successfully surpasses this resistance region, an impulsive rally toward higher price levels will be imminent.

The 4-Hour Chart
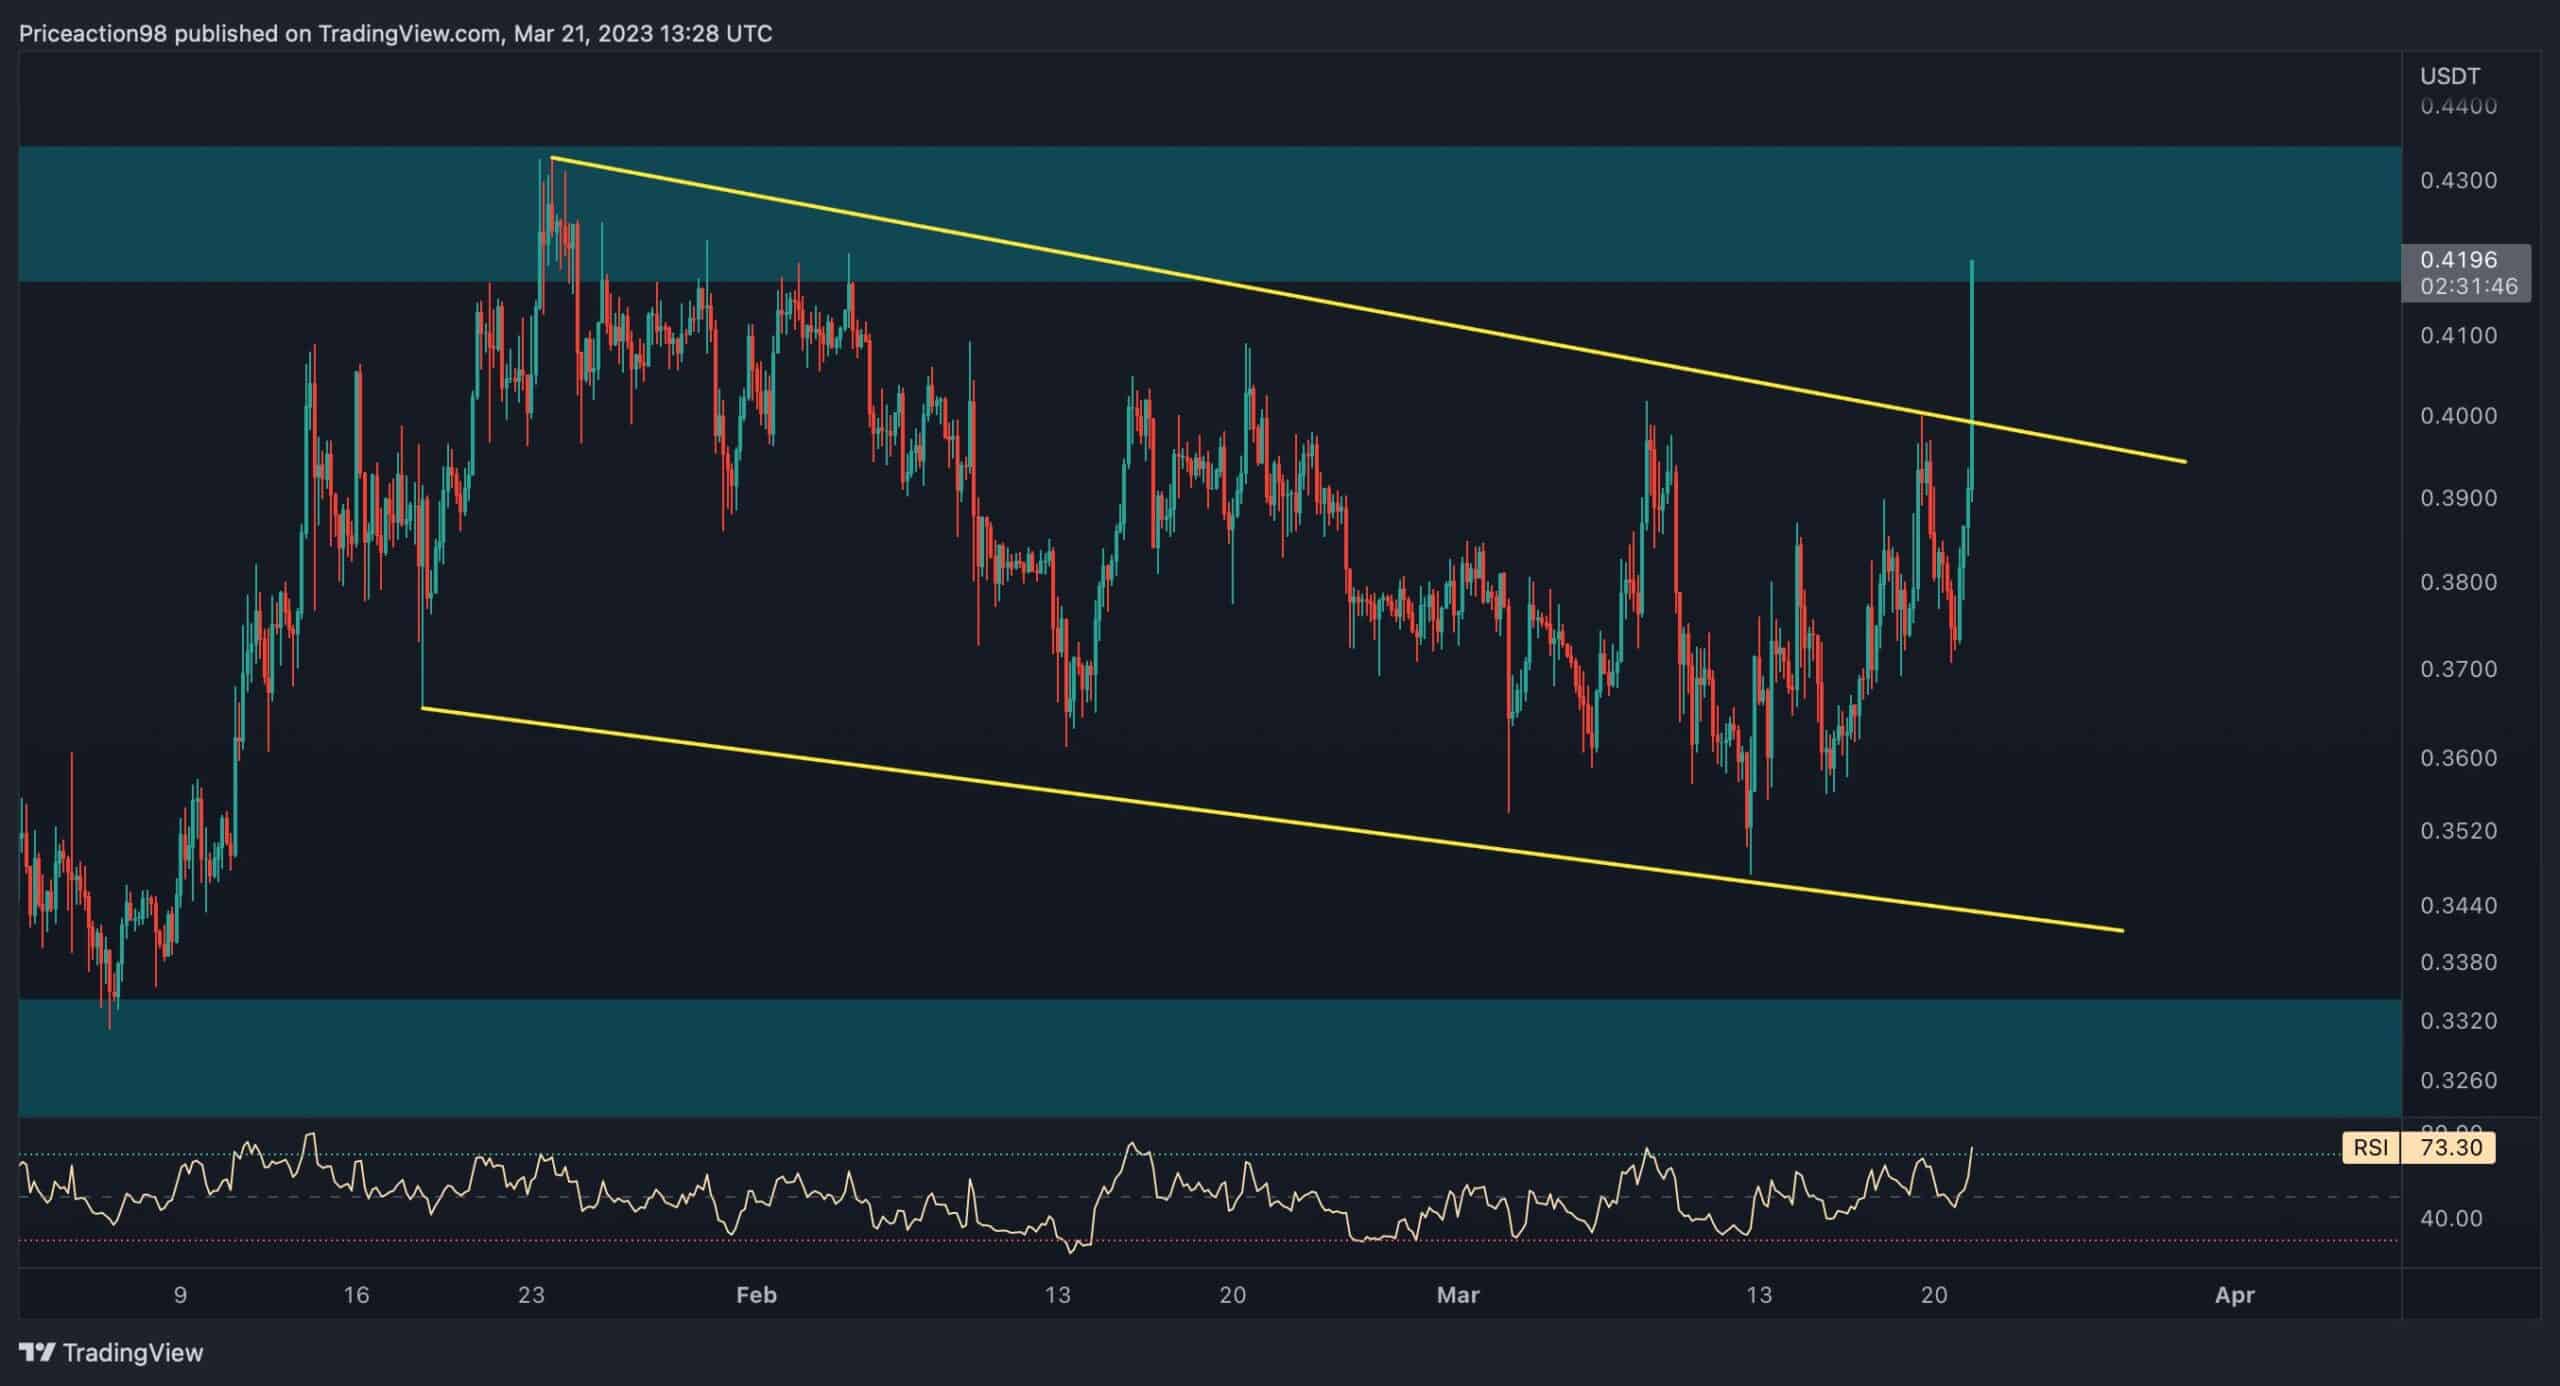
Ripple’s price has remained stagnant between $0.32 and $0.43 and has not broken out of this range for a considerable period. Additionally, the price has formed a descending wedge pattern, highlighted by yellow trendlines.
However, the price has recently experienced a surge and surpassed the wedge’s upper boundary, printing a bullish sign for the currency’s outlook. Yet, the cryptocurrency faces an important resistance region consisting of the $0.44 level and the prior major swing at $0.4330.
In case the price breaks this vital resistance, XRP could initiate a bullish rally and perhaps even try $0.50 next.
The post XRP Testing Crucial Resistance, is $0.5 in Play? (Ripple Price Analysis) appeared first on CryptoPotato.

