XRP Struggling to Recover, is $0.5 in Sight? (Ripple Price Analysis)
XRP has continued to drop for more than a year after hitting its highest level at $1.96 in April 2021, which has disappointed holders. What are the main challenges?
Technical Analysis
By Grizzly
The Daily Chart:
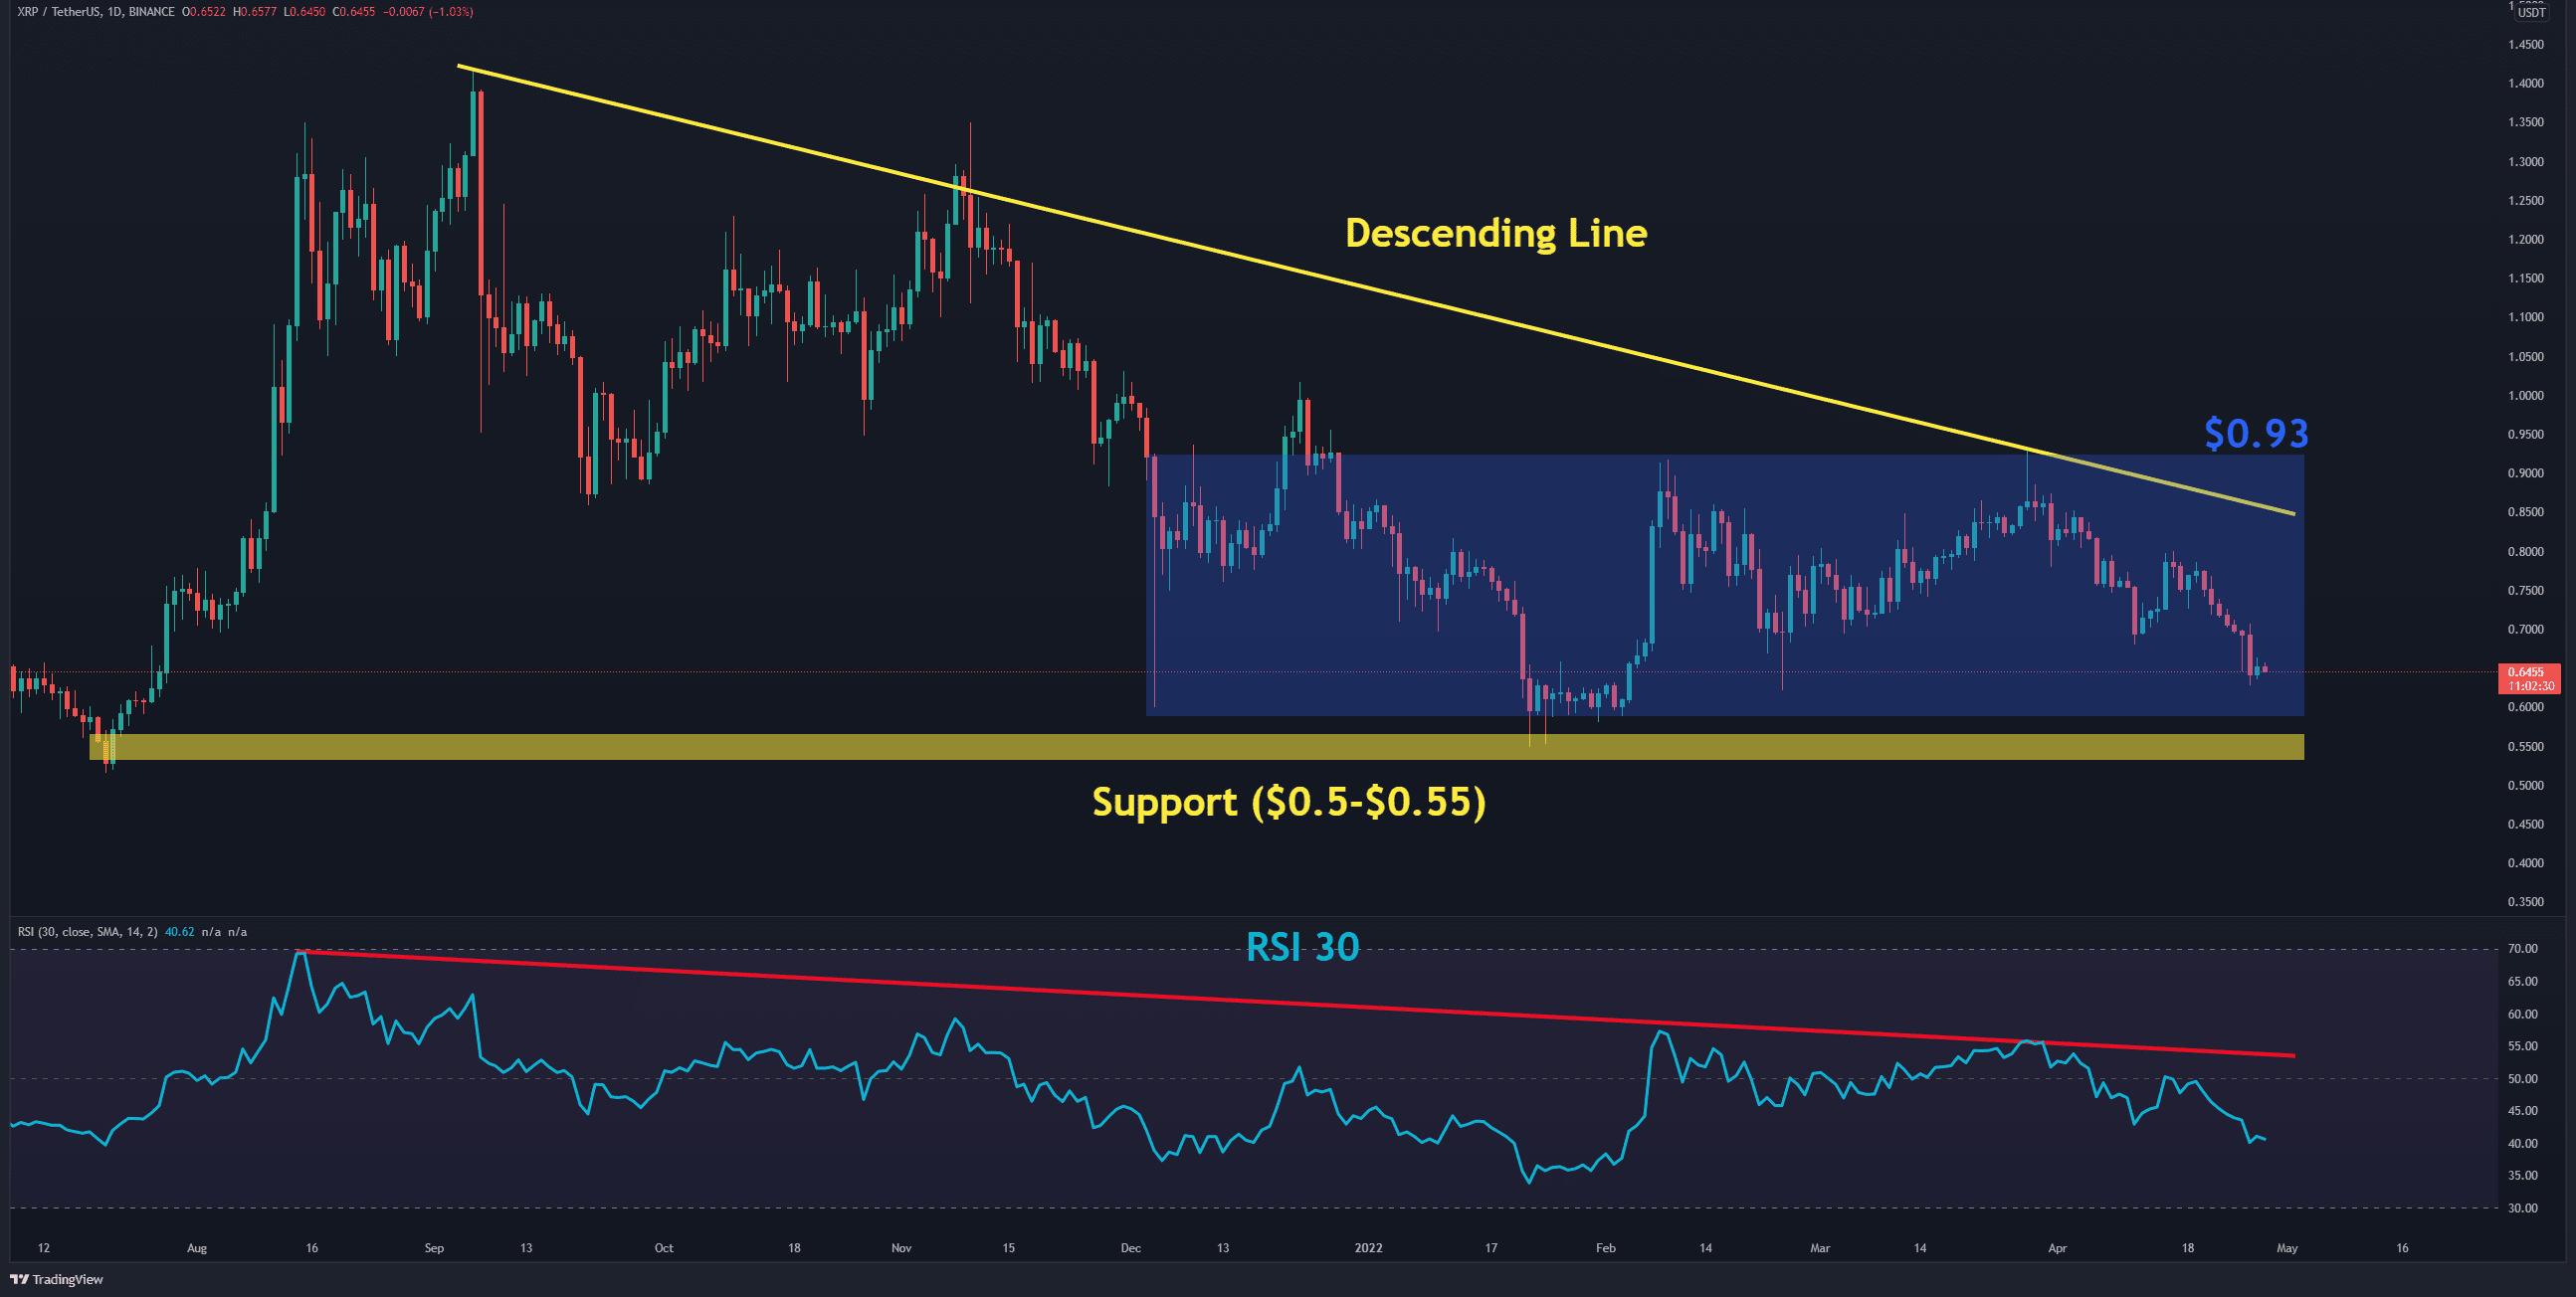
The price fluctuates within a triangle (marked yellow) on the daily timeframe, and the descending line that has accompanied it for more than 230 days has not been broken yet.
The blue rectangle has made the top and bottom of the price movement. The resistance is found at $0.93, and the support – is around $0.6. If the bulls break above the current sideways chop by crossing the yellow line, they could aim for the resistance. Otherwise, $0.5 might even come into play.
The RSI 30D indicator has been below the red line for a long time, and it is clear that sellers have the upper hand now.
Moving Averages:
MA20: $0.72
MA50: $0.77
MA100: $0.74
MA200: $0.86
The 4-Hour Chart:
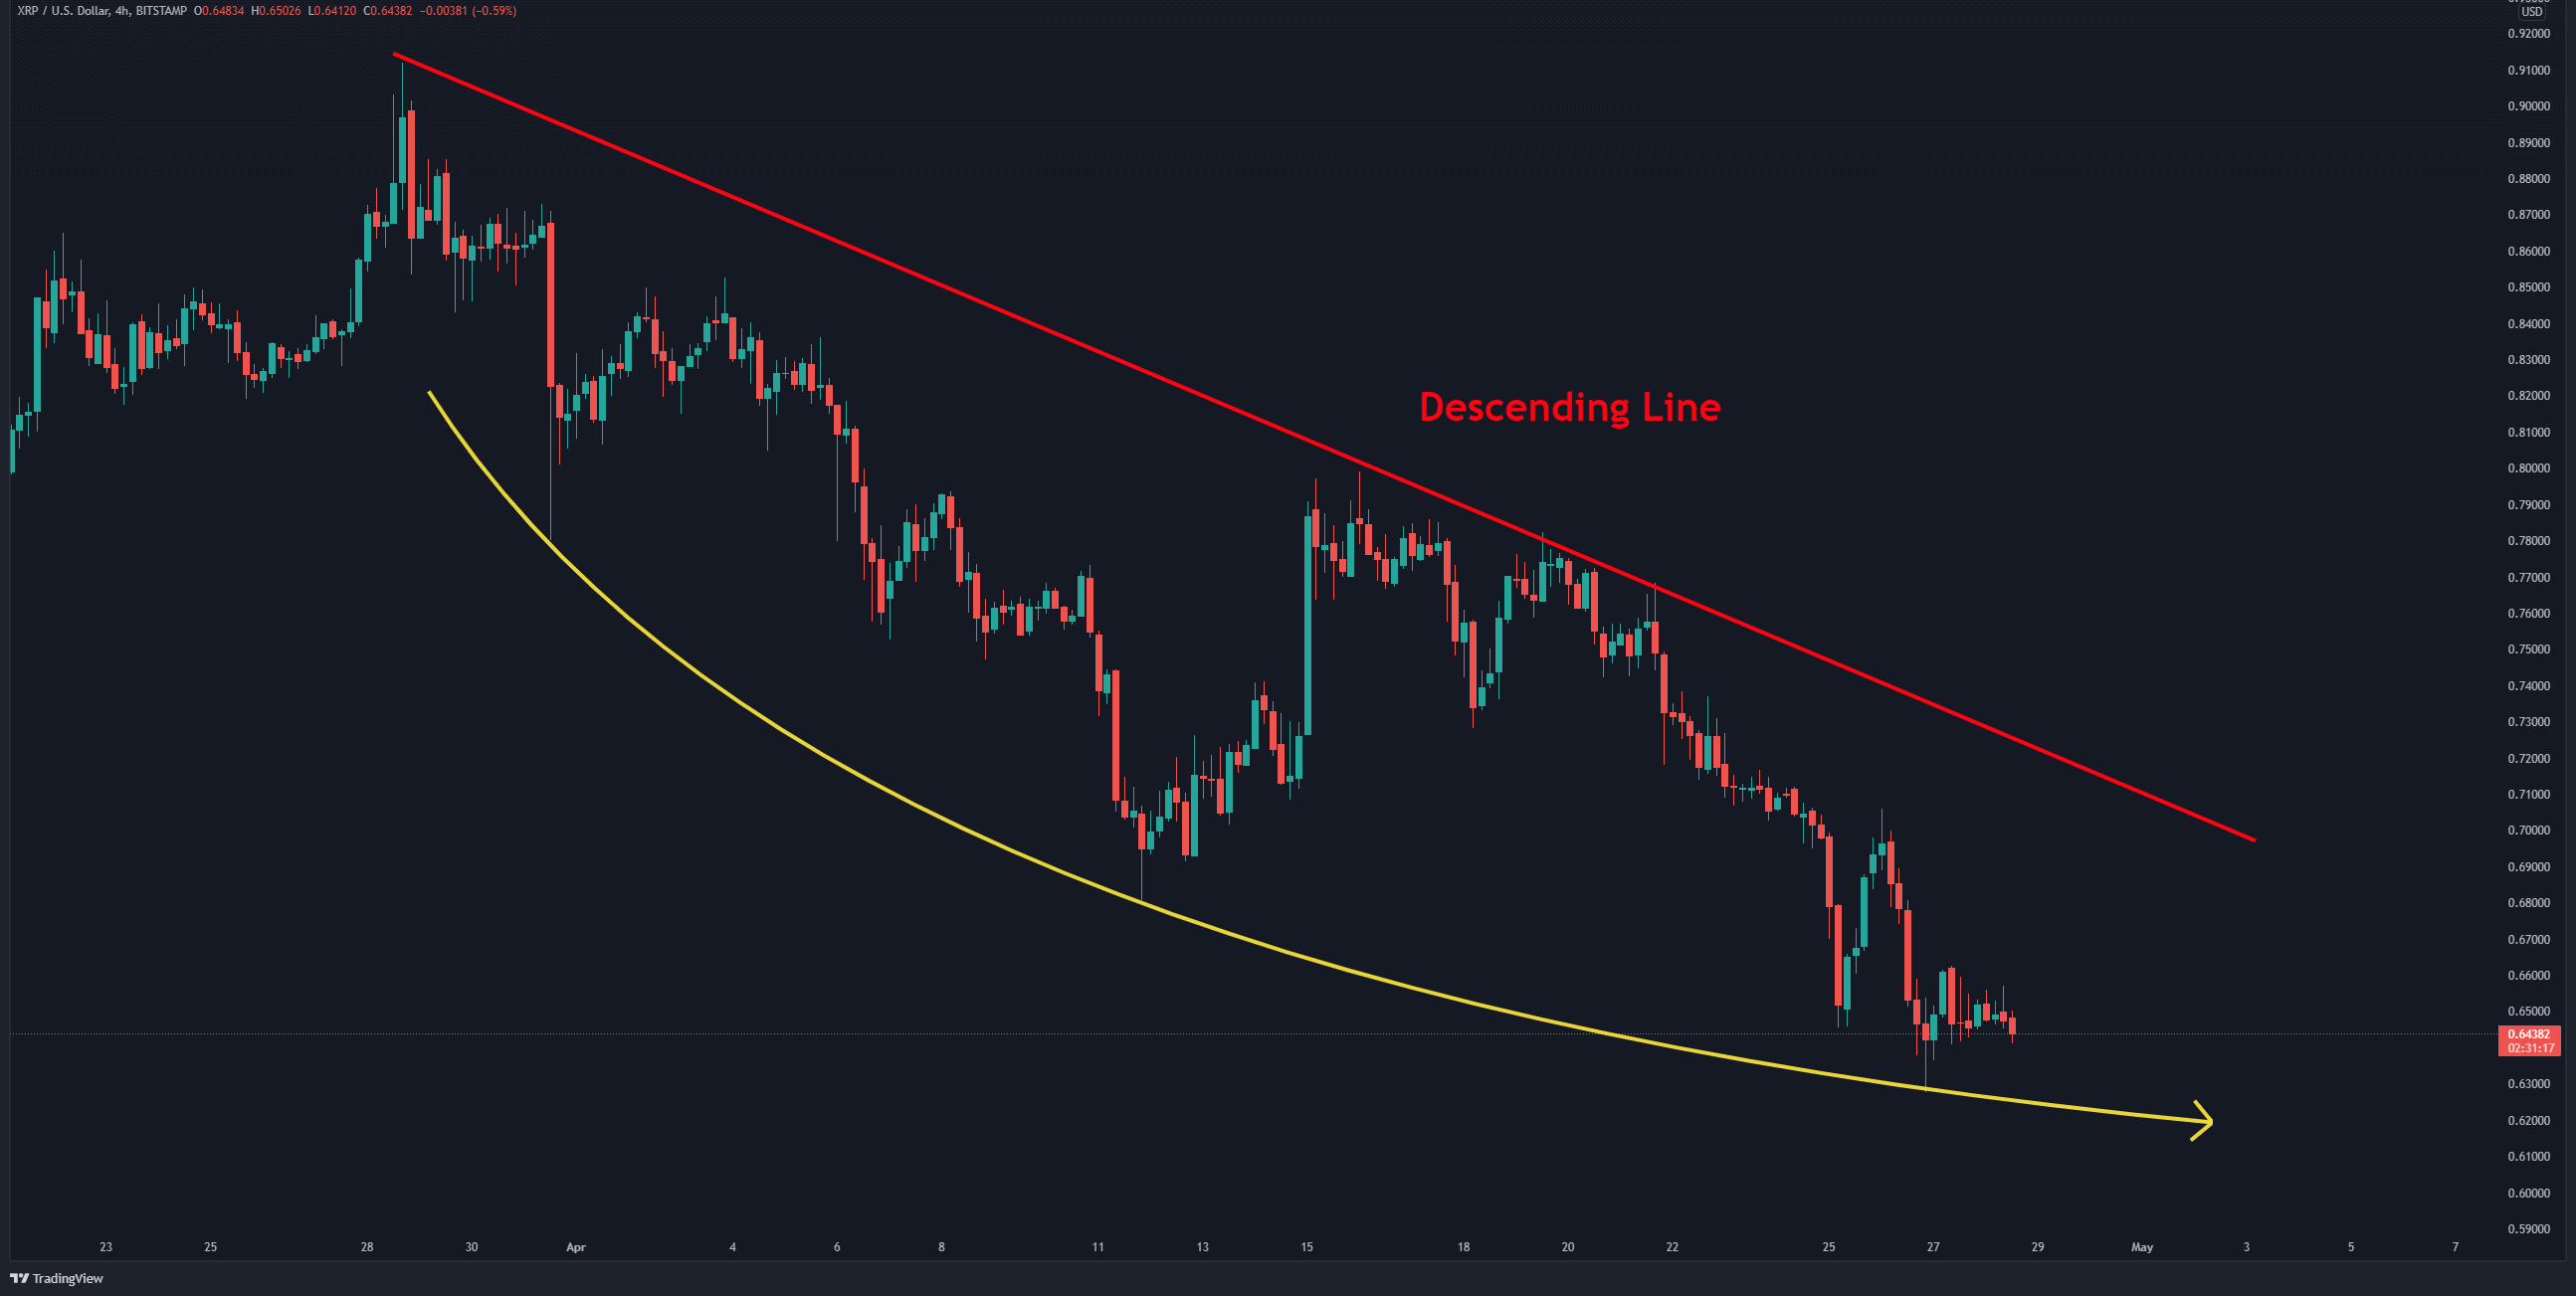
On the 4-hour timeframe, the descending line has been a tough barrier to crack, and XRP has formed a lower low after each touch.
If the bulls keep the price in the same range and do not allow another lower low to form – one can expect the downtrend momentum to decrease gradually and the price to move back to $0.7.