XRP Struggles Amid Critical Support: Ripple Price Analysis
Ripple’s price has been mostly bearish over the past few weeks following a rejection from the critical resistance level of $0.9. XRP has also been trending in the negative territory compared to BTC (XRP / BTC).
Technical Analysis
By Edris
The XRP-USDT Chart
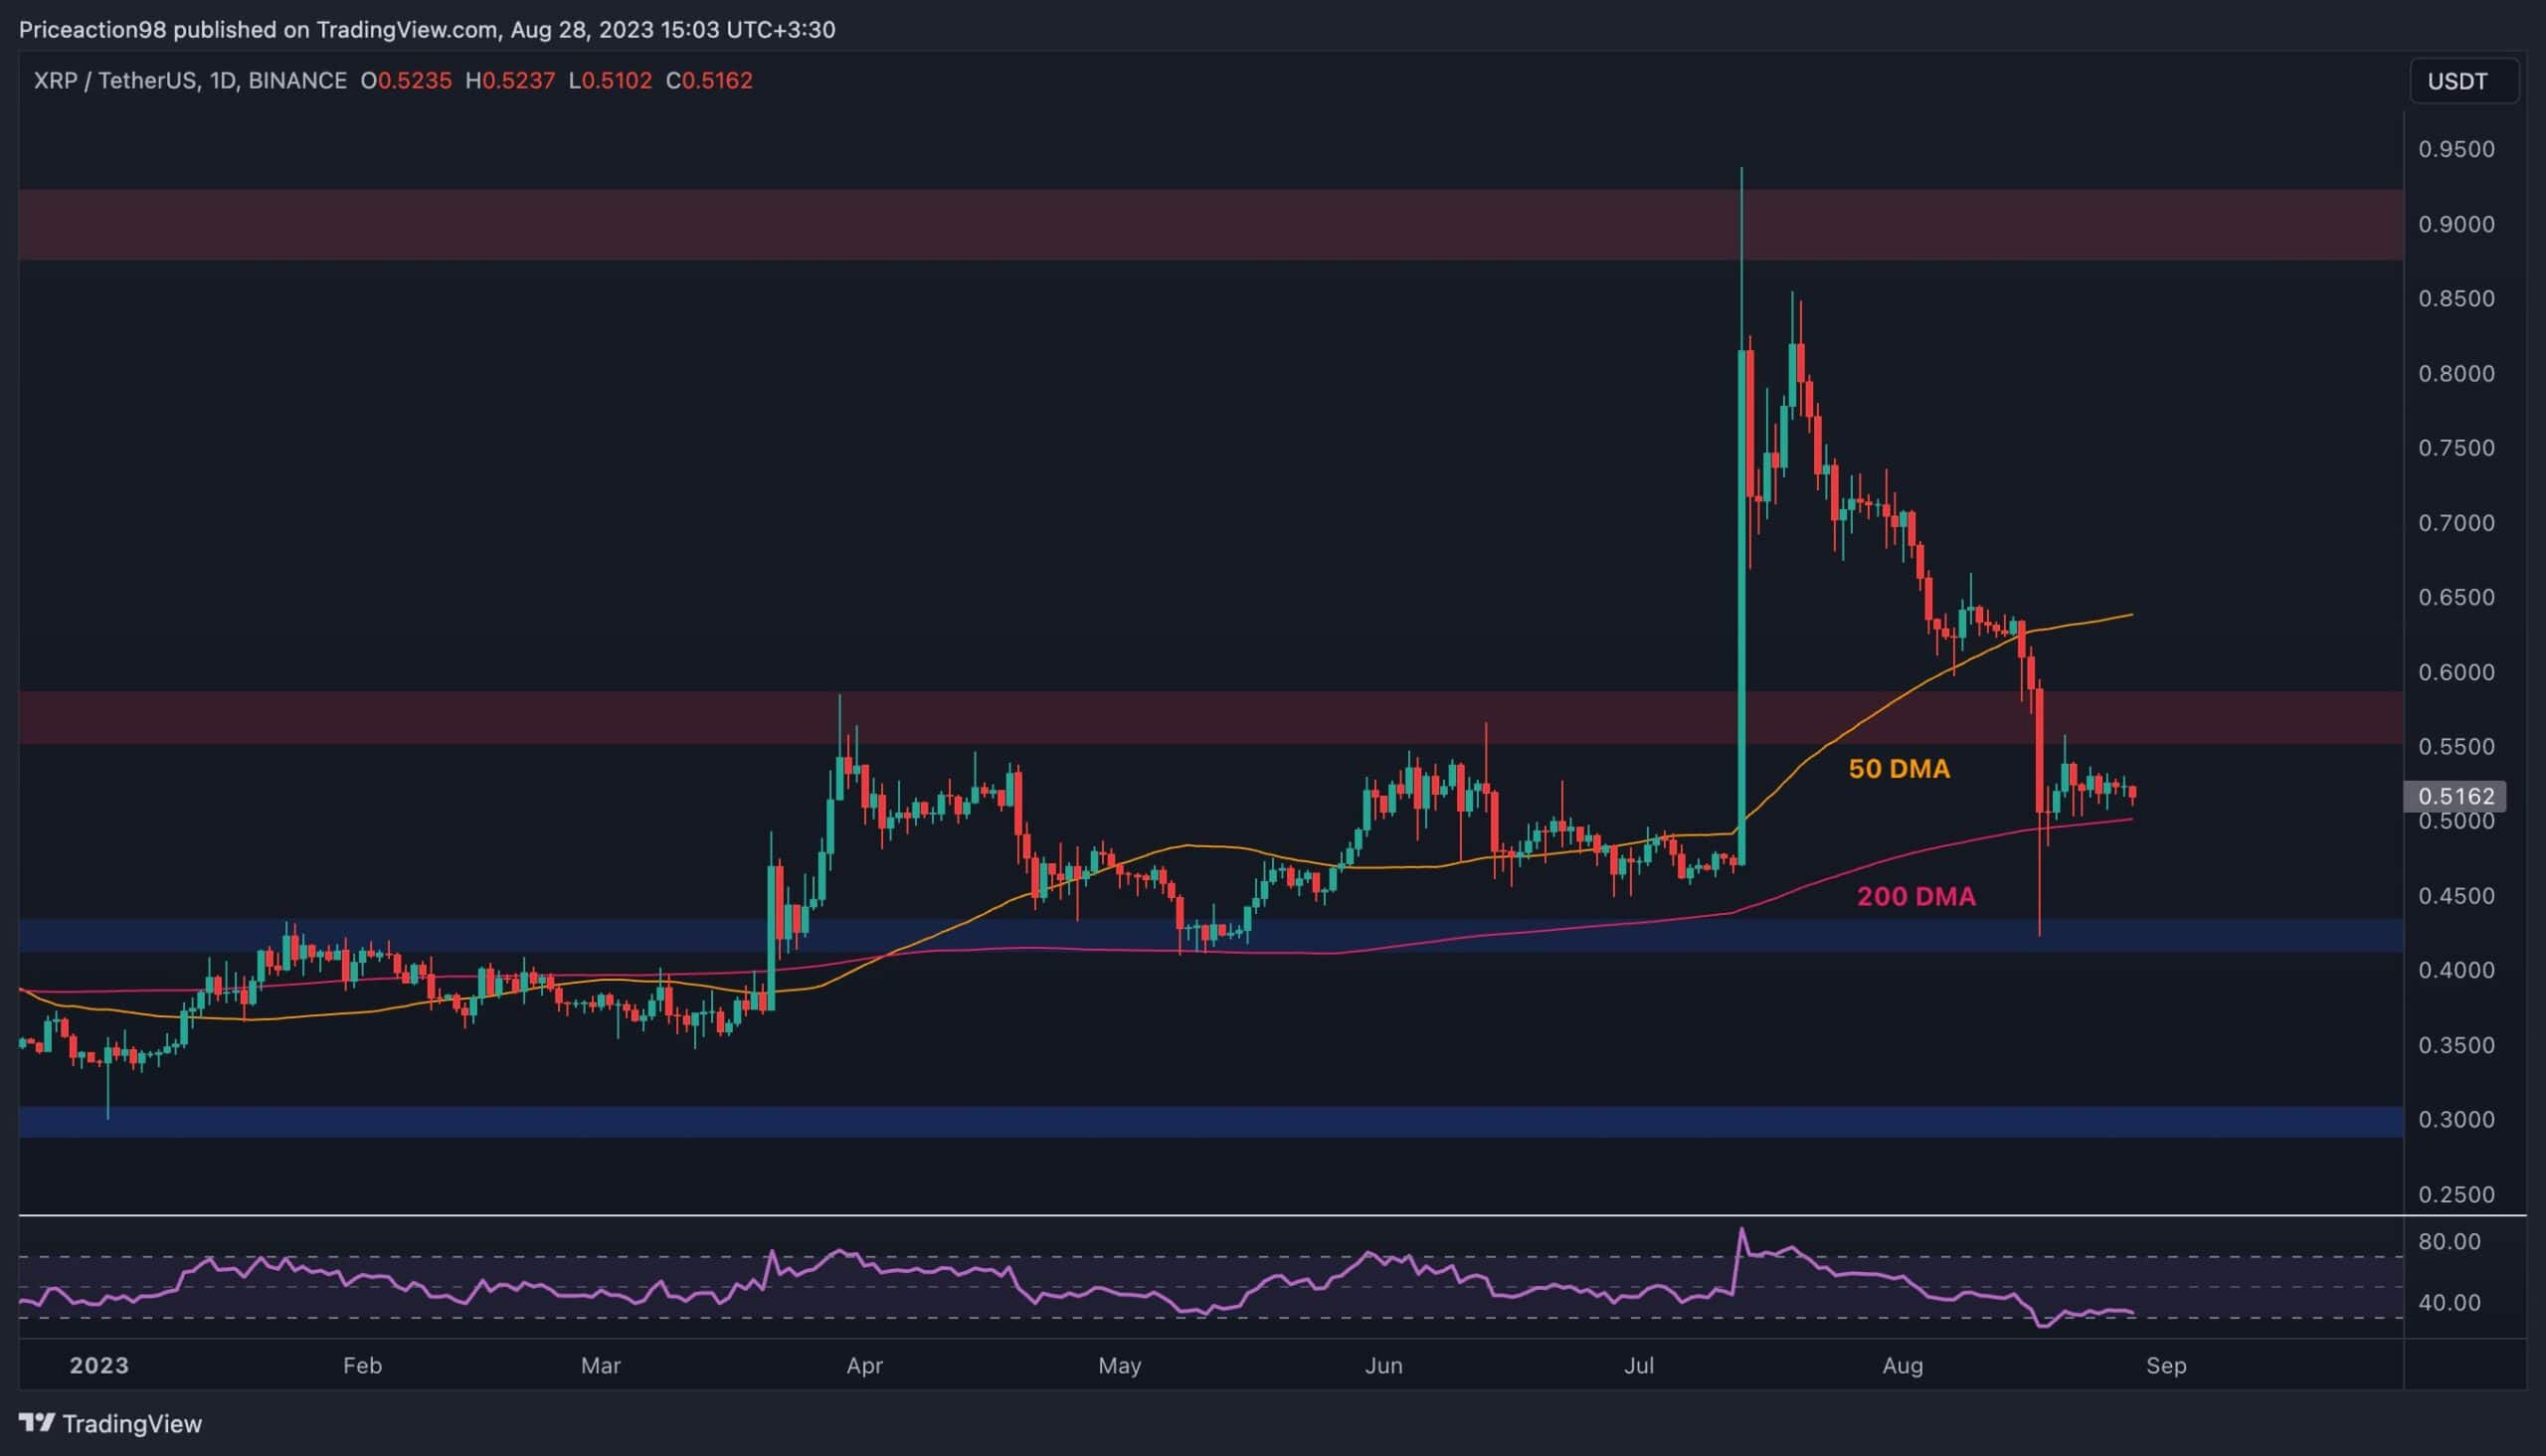
On the USDT-pair chart, XRP has been dropping rapidly lately. The 50-day moving average, located around the $0.63 mark, and the static $0.55 level have been broken to the downside following significant momentum and volume. Currently, the market is consolidating above the 200-day moving average near the $0.5 level, and the price has yet to close below it.
Considering RSI’s recovery from the oversold region, a bullish pullback to retest the $0.55 support turned resistance level, or even the 50-day moving average is probable. However, the trend remains bearish, and lower prices can be expected in the coming weeks.
The XRP-BTC Chart
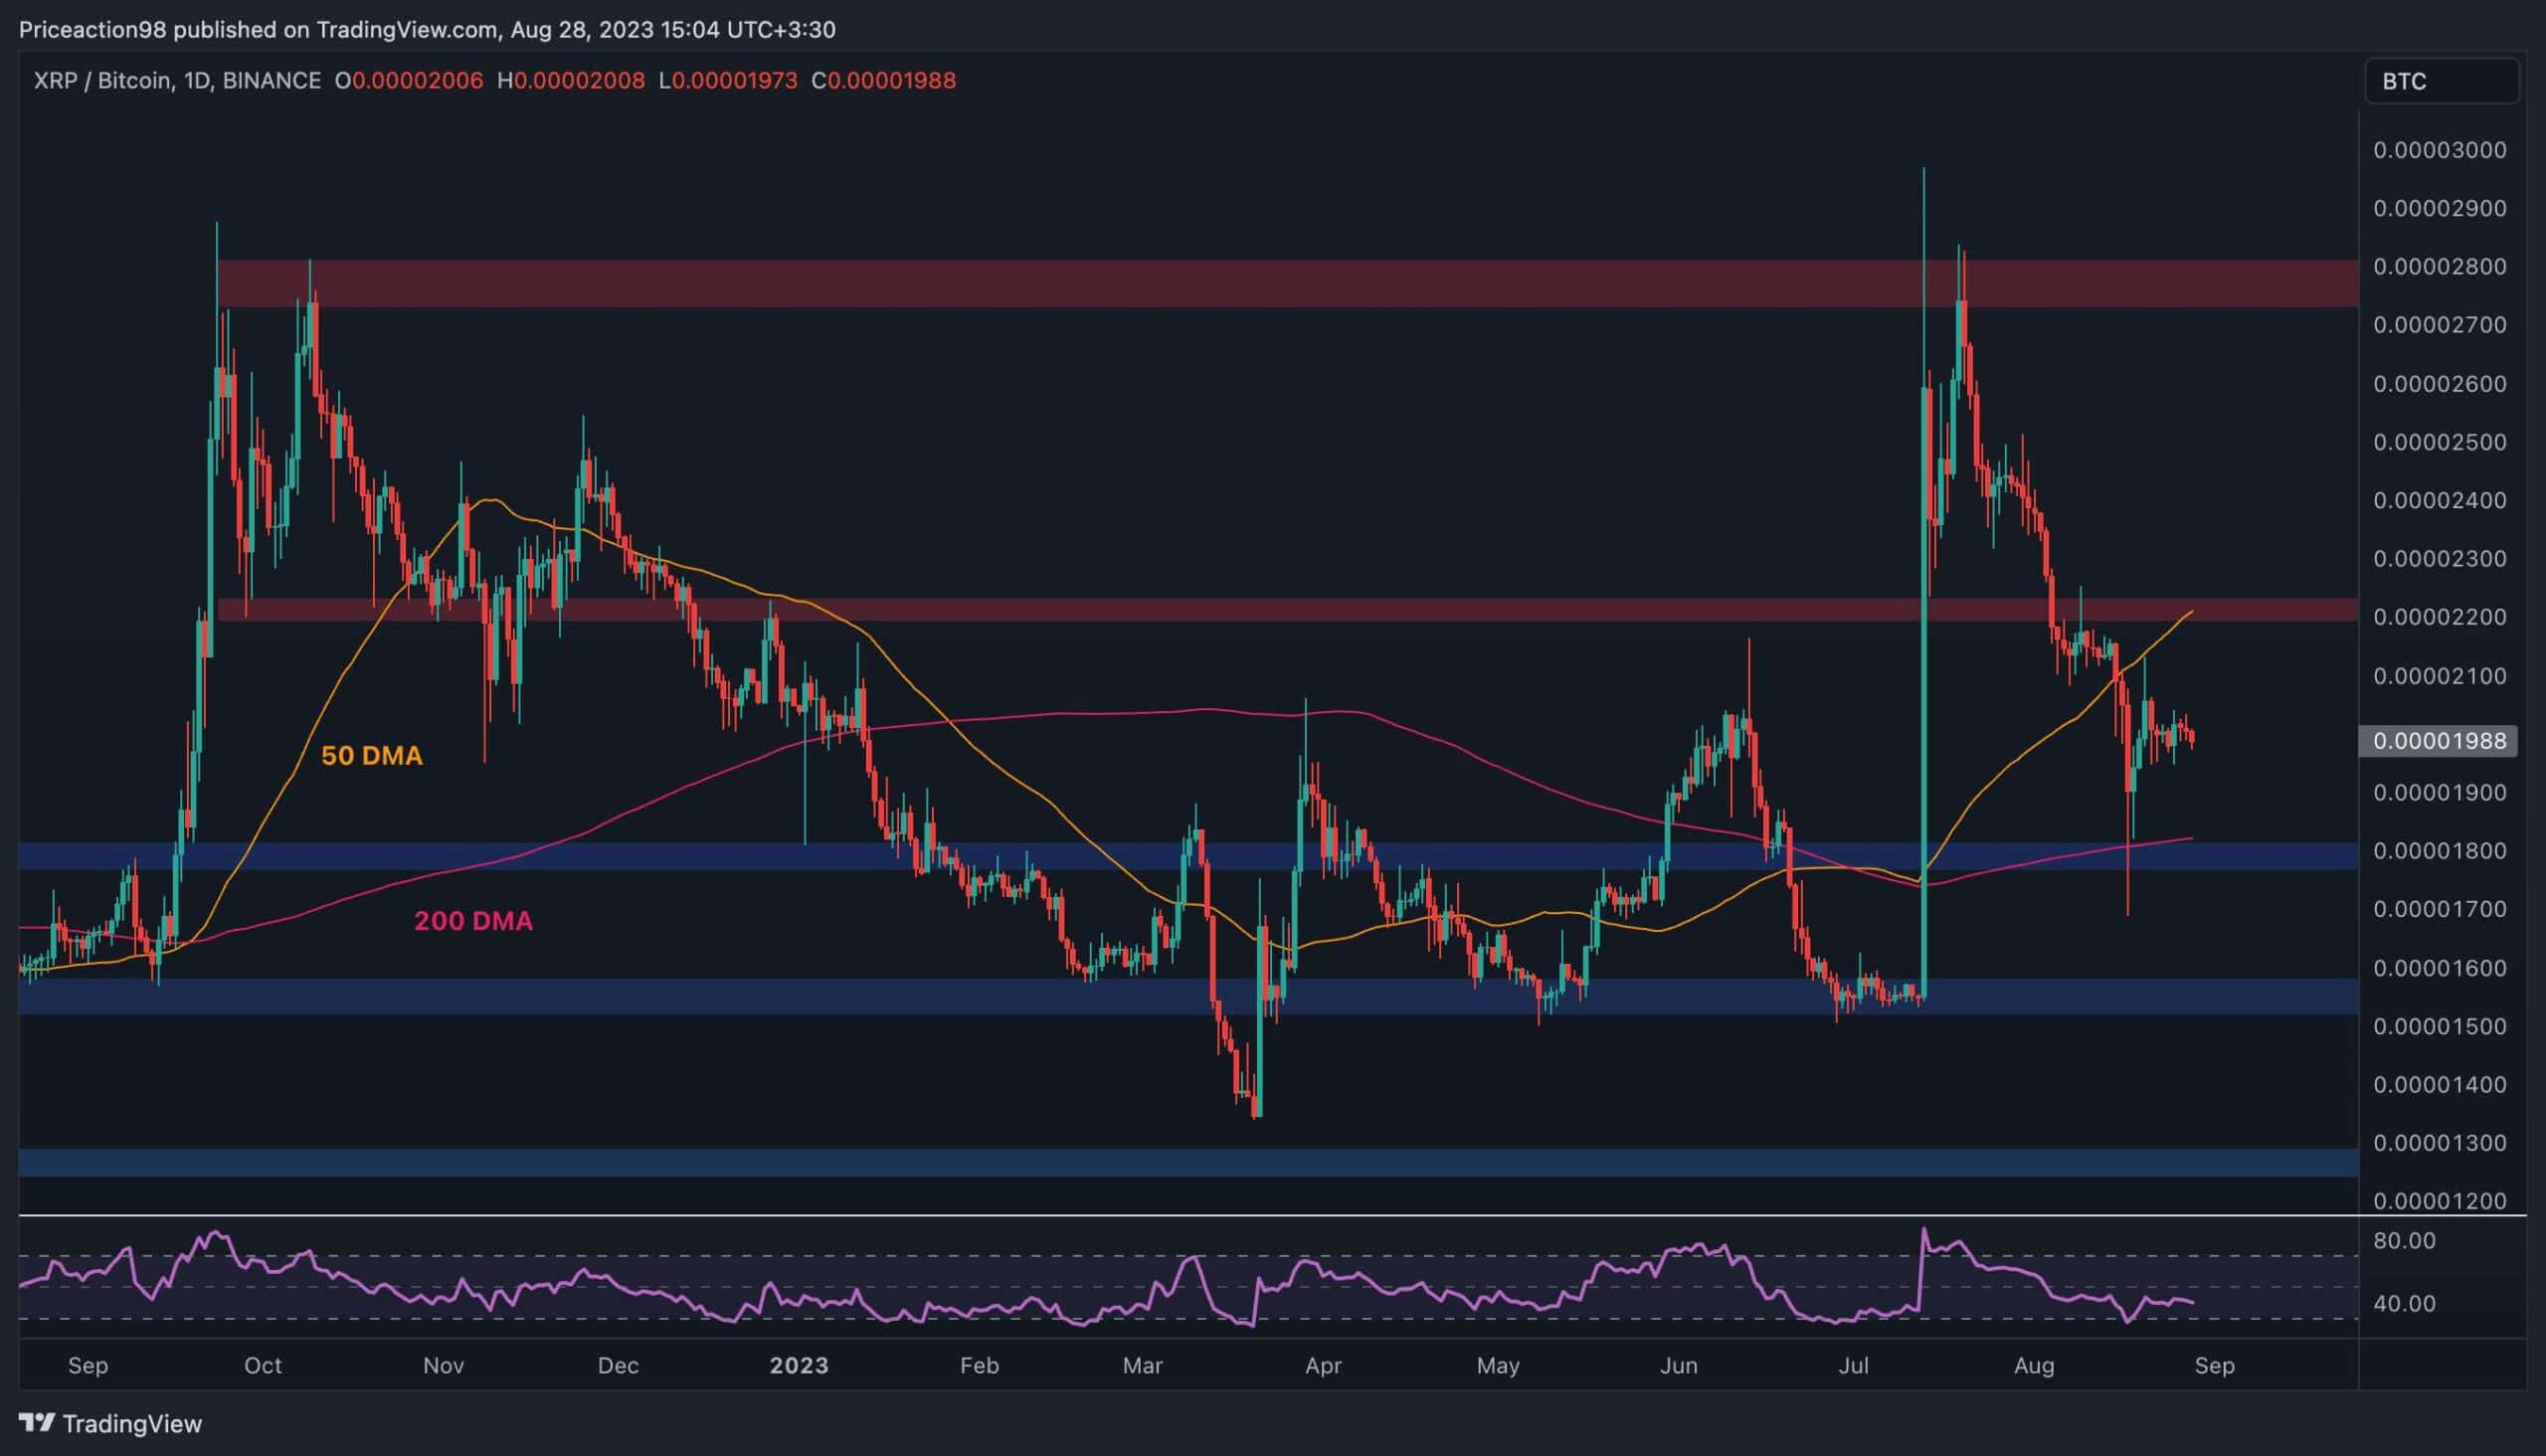
Looking at the BTC pair, things look pretty similar. XRP’s price has dropped below key support levels and ranges between the 200-day moving average and the 50-day moving average, trending around the 1800 SAT and 2200 SAT levels, respectively.
A breakout from this range will likely determine Ripple’s short-term price action. Yet, as the market structure suggests, a further bearish move seems more probable, with the RSI showing values below 50%.
The post XRP Struggles Amid Critical Support: Ripple Price Analysis appeared first on CryptoPotato.